Is there any way to create a column chart to show yearly performance for anything other than the Entire Portfolio?
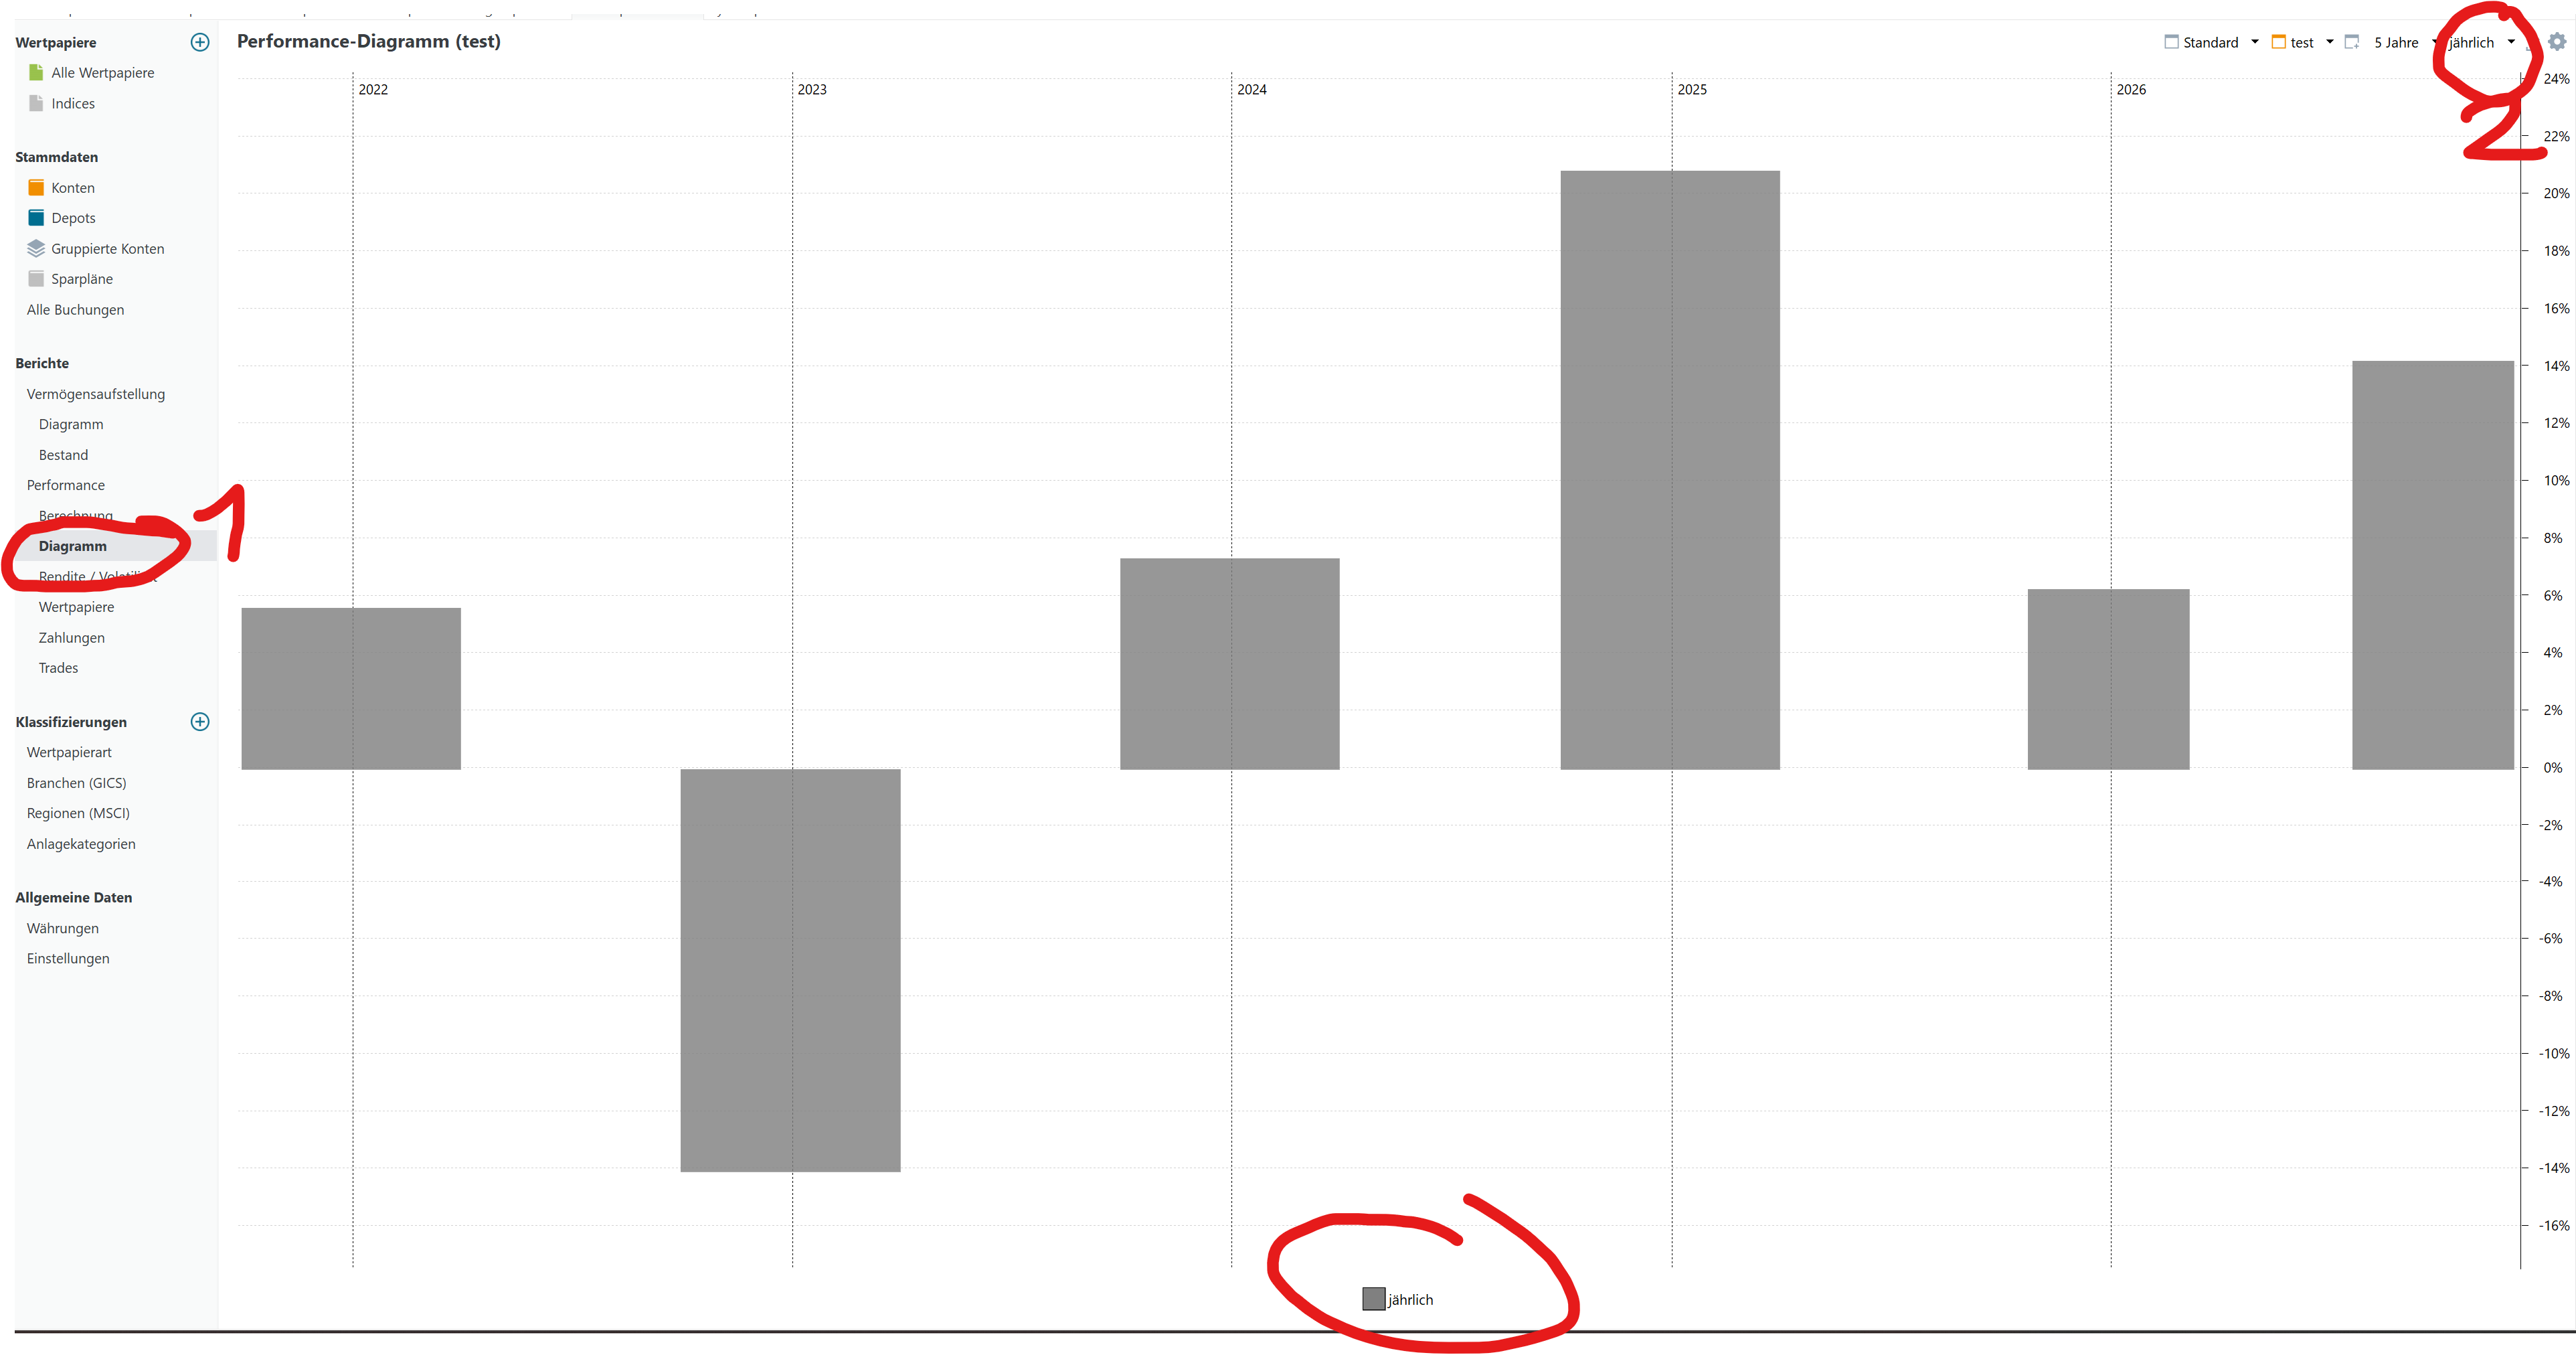
From another post I can see how to create a column chart for the Entire Portfolio “Pick Data Series > Common > Daily” but I would like to view the performance of a specific Grouped Account /or a Taxonomy and I can’t find a way of doing this
Obviously I can see the values in a Yearly Performance heatmap but I was hoping to create a column chart
Not really. I think this would be very nice to have but I was thinking of something much simpler.
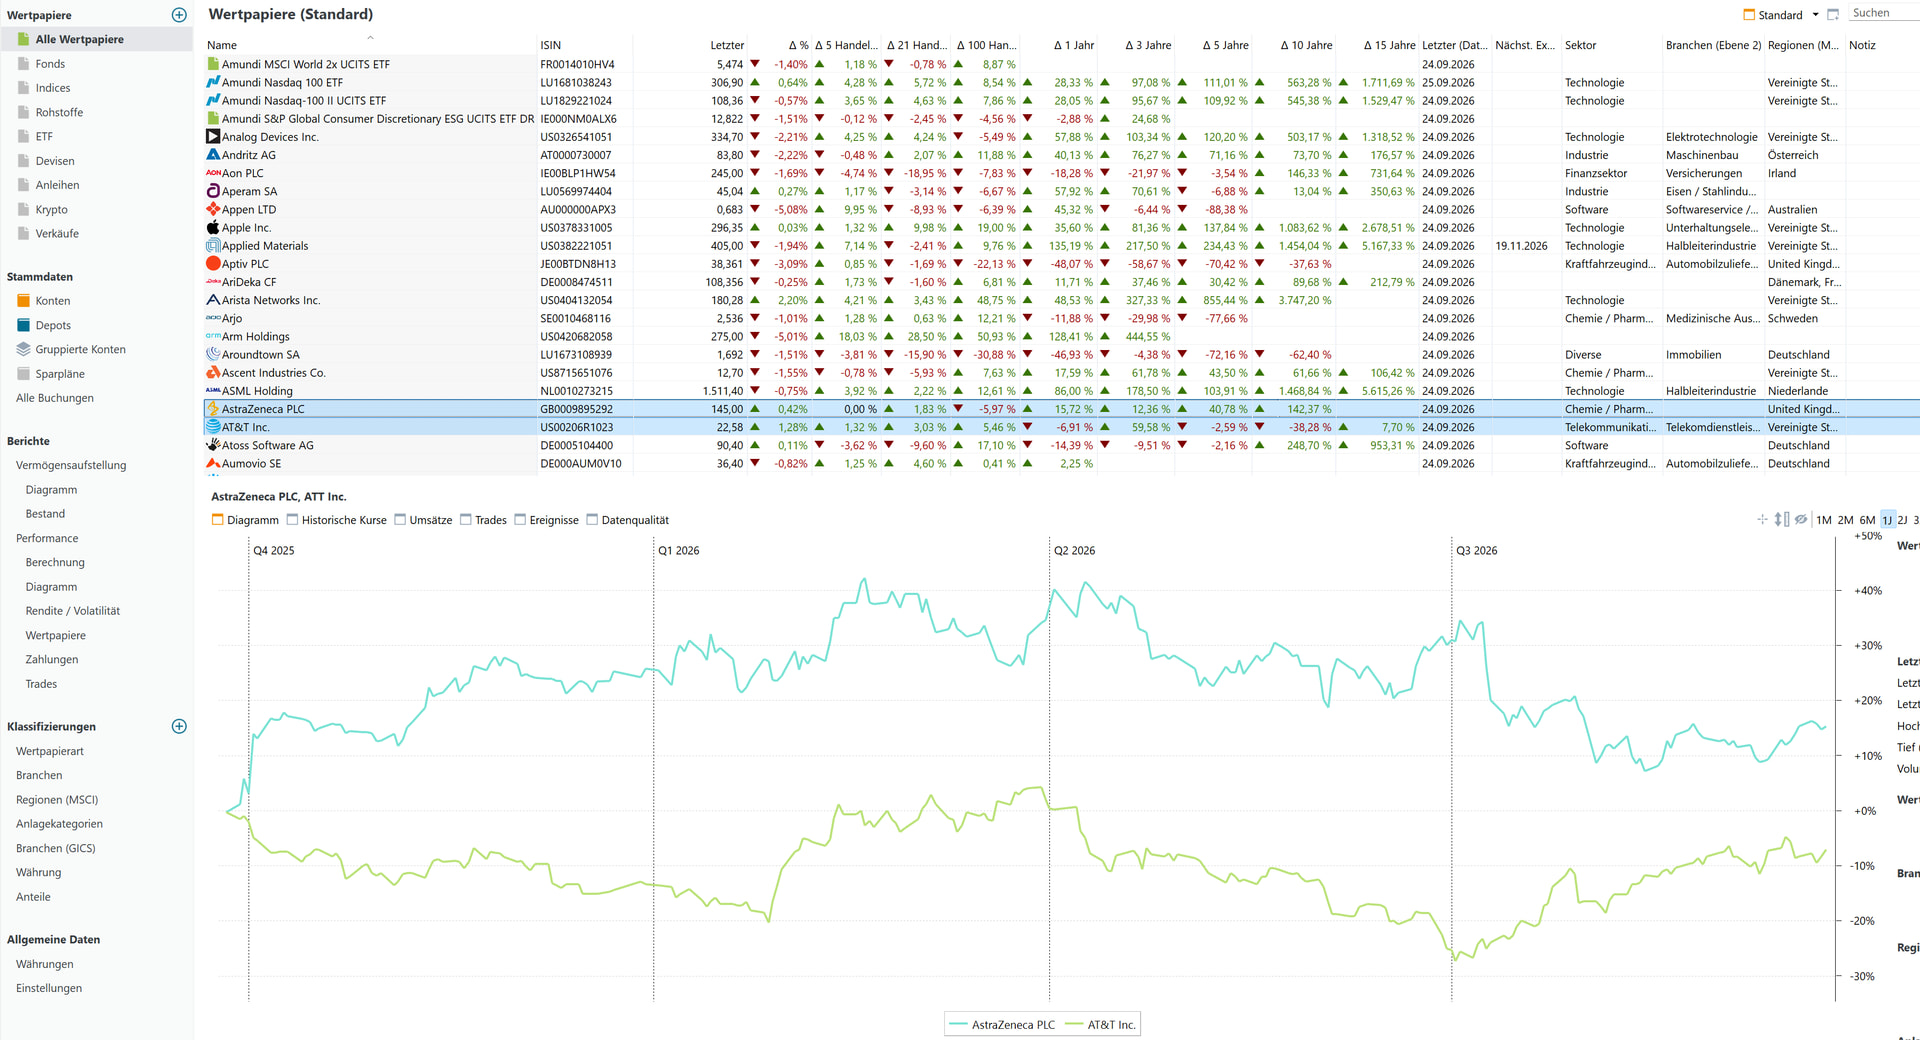
This request seems to be more complicated as it would be a line graph comparison of how different years evolve but doesn’t actually present a column chart.
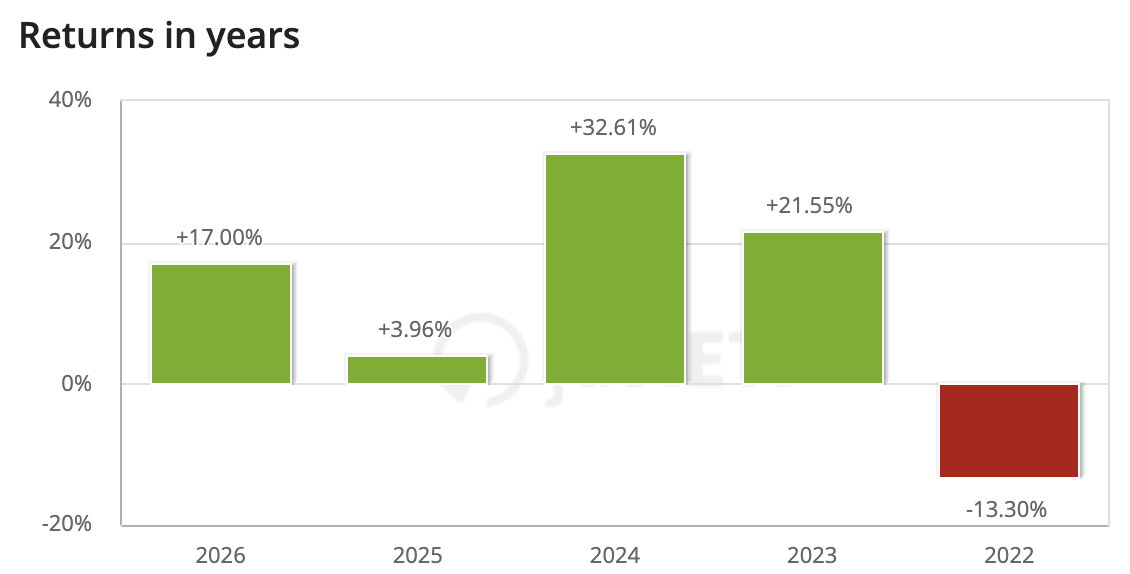
I was thinking of the typical performance column charts you can find in justETF for example. I’ve pasted an example below
Thanks for the suggestion but unfortunately this doesn’t solve my problem.
This was the method I referred to in my original post as “Pick Data Series > Common > daily” but the , for me, very significant limitation is that it only works on the Entire Portfolio. Or at least I can’t see how to get it to produce a column chart for anything other than the entire portfolio.
Hence my question if there was any way of getting this to work for a Grouped Account or even a Taxonomy.