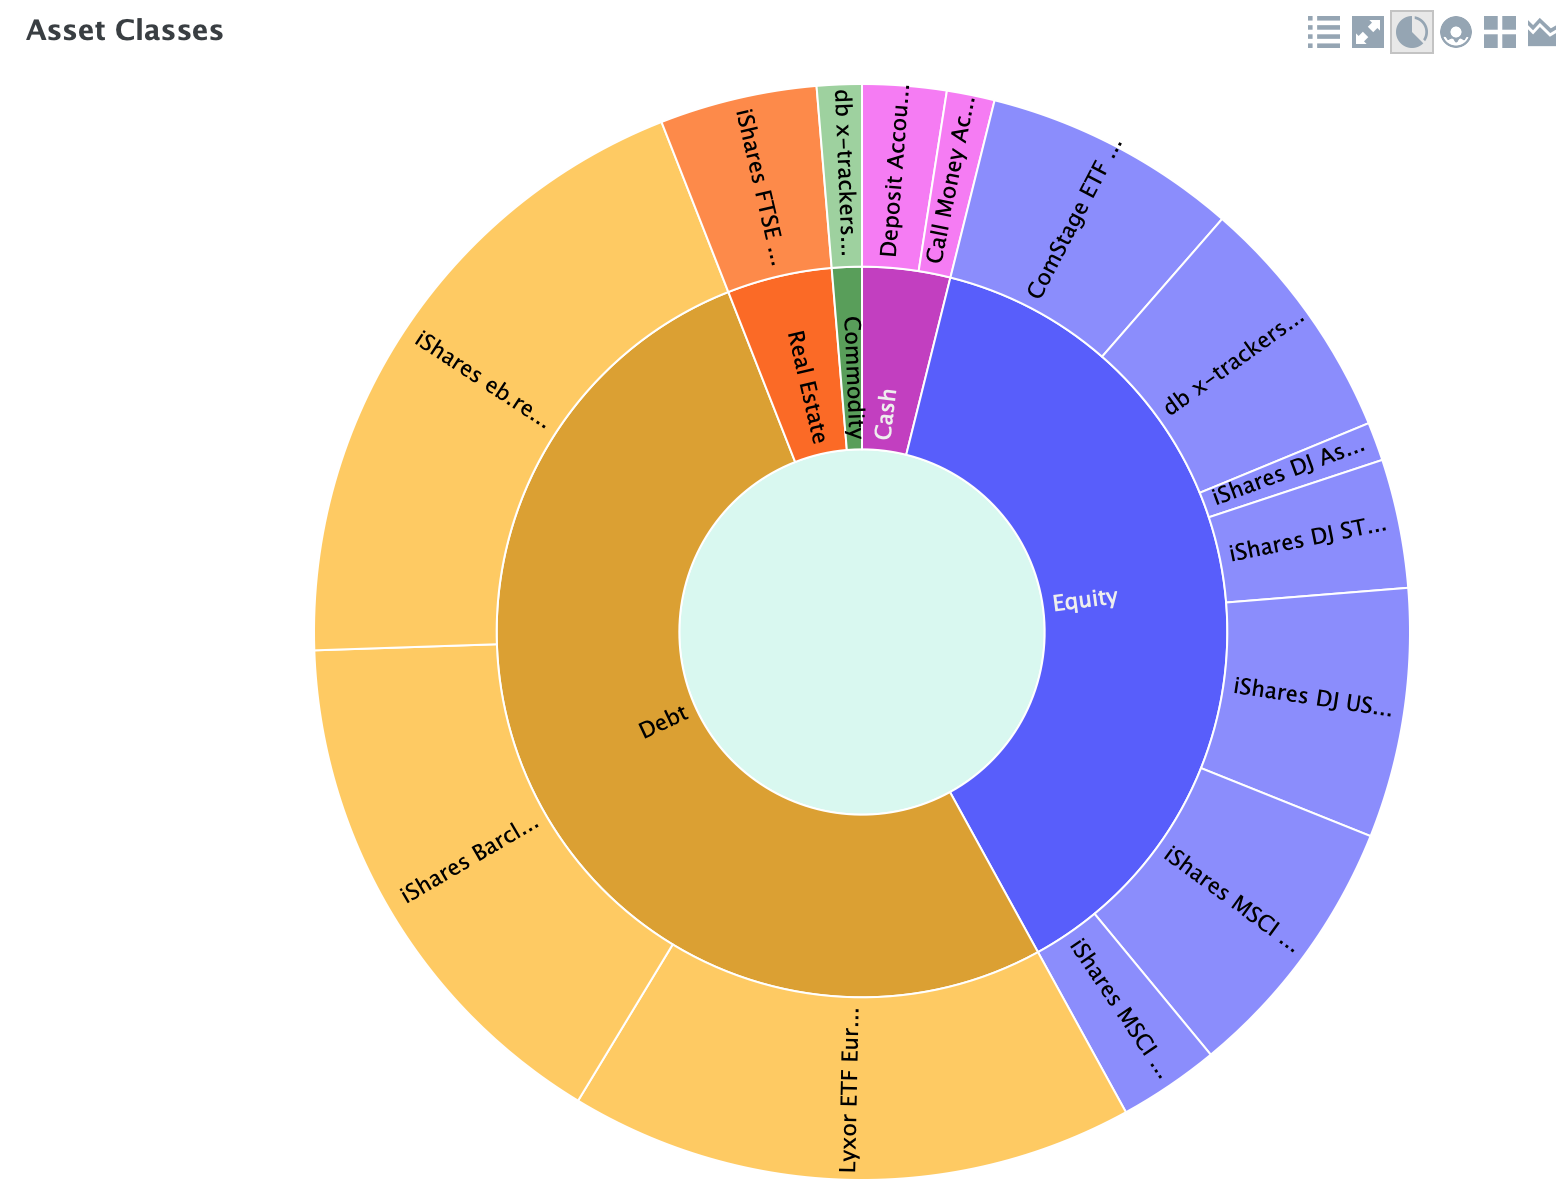
If you go to the taxonomy view itself, you have two pie charts that sort and color the securities by the classifications you created for the taxonomy.
If you go to the taxonomy view itself, you have two pie charts that sort and color the securities by the classifications you created for the taxonomy.