As a long-time Portfolio Performance user, I developed a personal script (my first app) to deepen the analysis of my holdings. This project, named SigmaScope, was born from a specific need: combining statistical technical analysis (linear regression) with fundamental data, while teaching myself how to code with Streamlit.
It is first and foremost a personal tool that I’ve enjoyed building for my own learning, and I wanted to share it with the community today.
Why this project?
The original idea was to bridge a gap in my usual data visualization:
Analyze my PP positions: I wanted to visualize the linear regression and Sigma (σ) bands specifically for the positions held in my Portfolio Performance account.
Visualize Average Cost (PRU): On the regression charts, I integrated the display of my Average Cost (PRU). This allows me to instantly see where my entry price stands compared to long-term statistical zones (overbought/oversold).
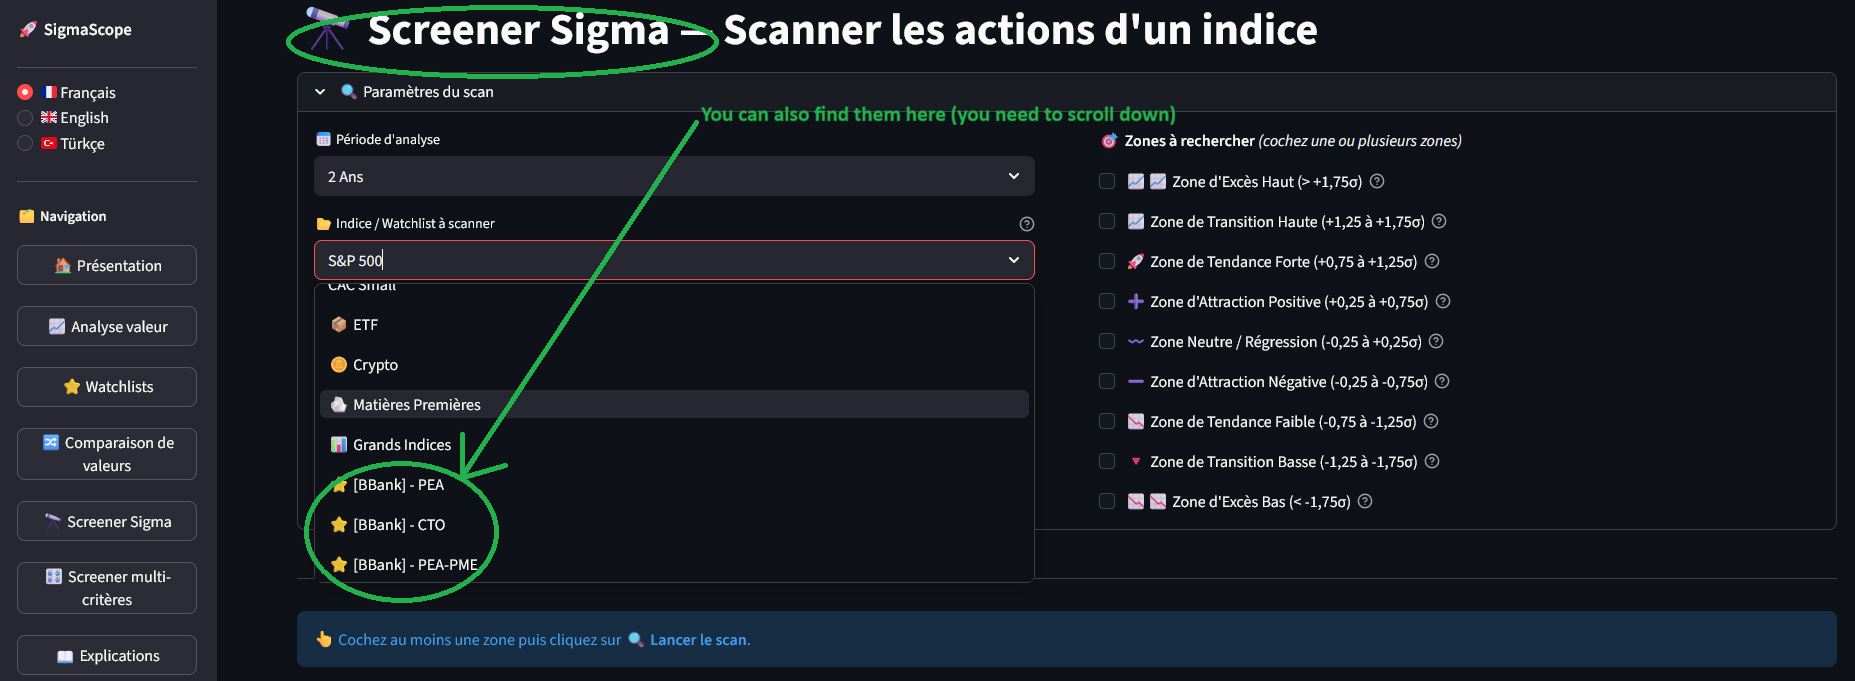
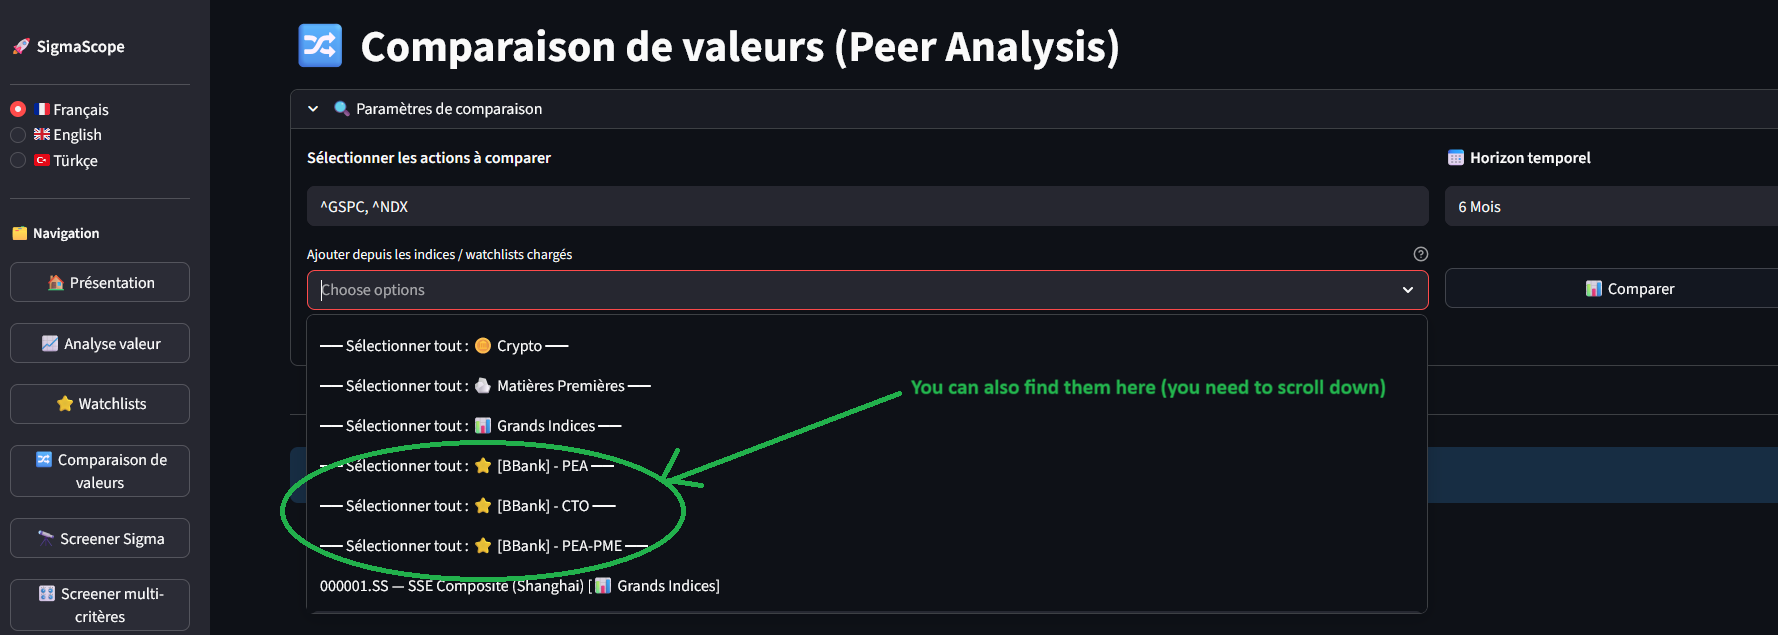
Index Screener: Quickly visualize regressions for an entire index (S&P 500, CAC 40, etc.) to detect diversification opportunities.
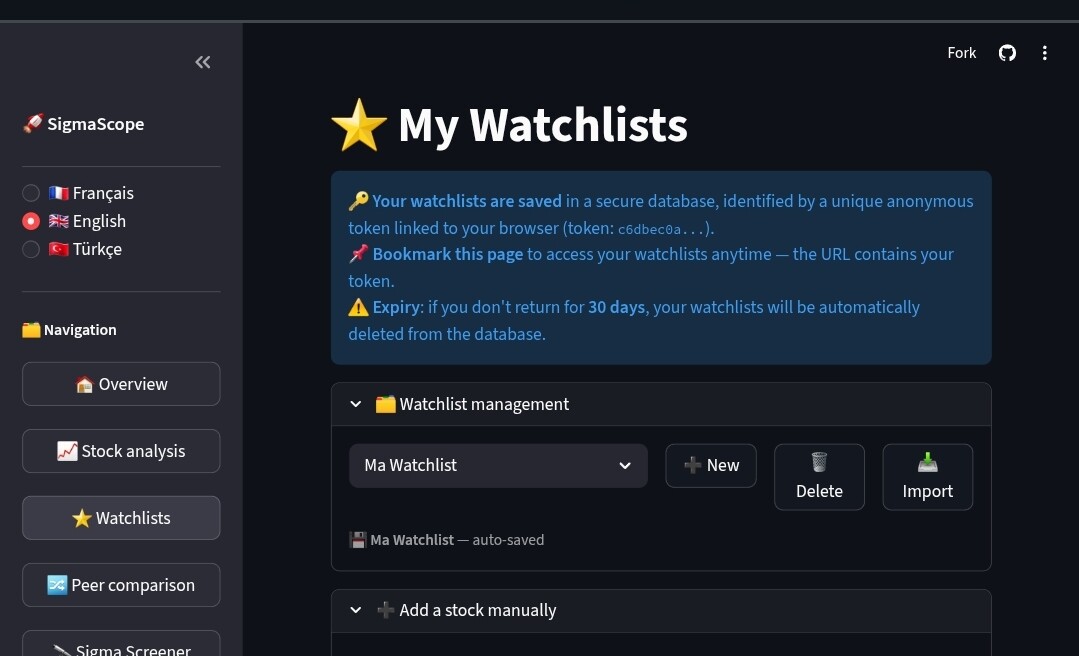
[Image 1: main.jpg — Main interface overview]
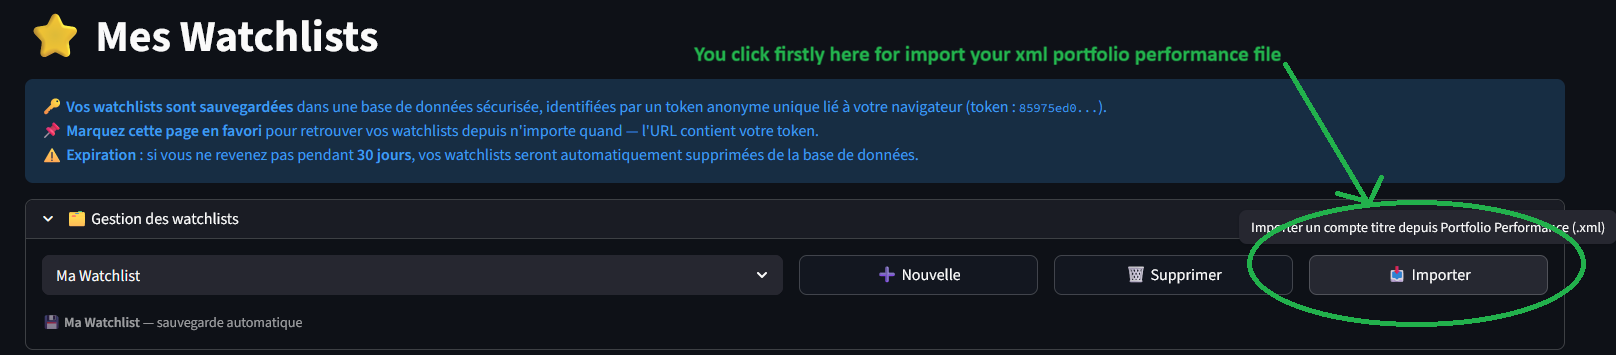
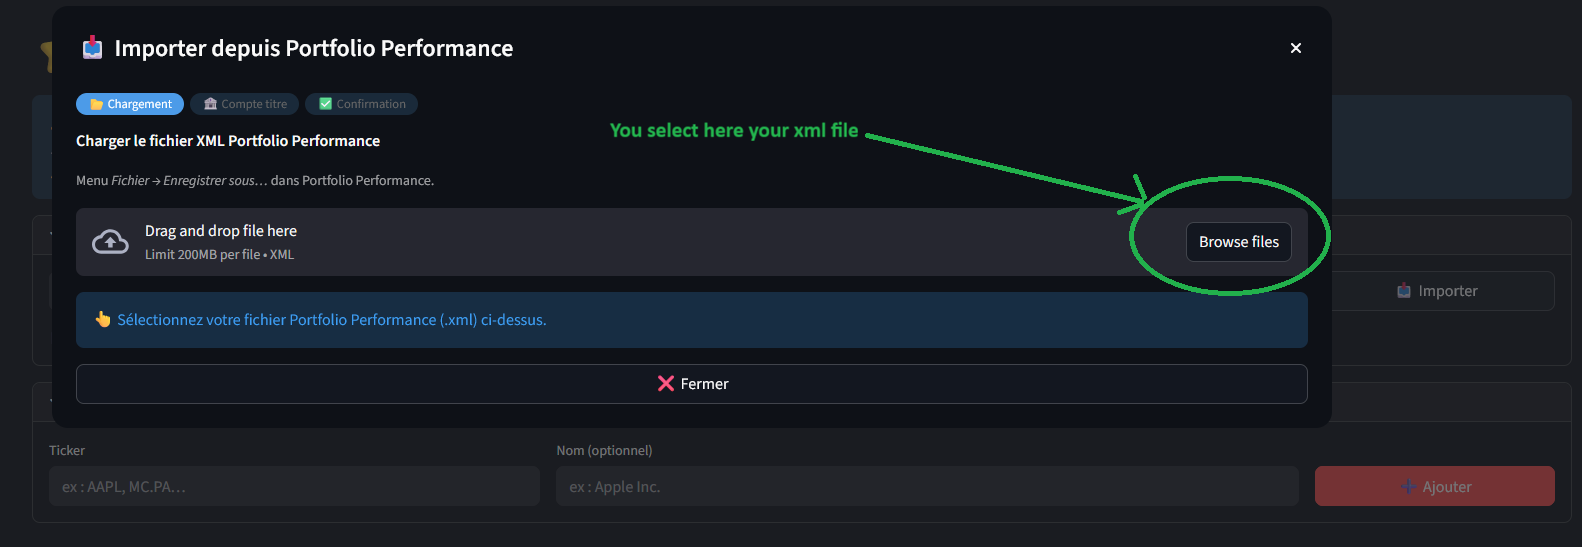
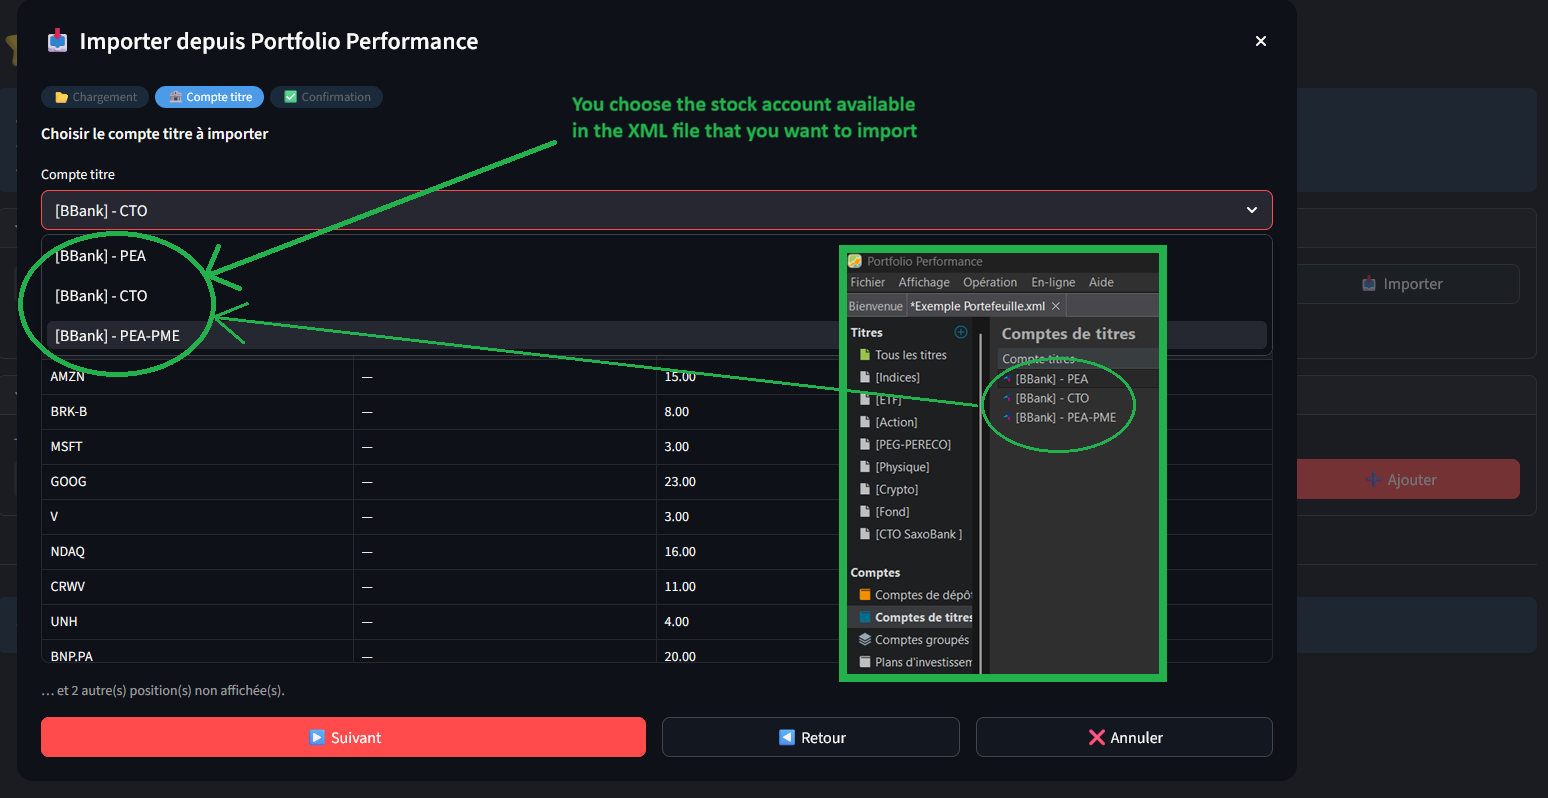
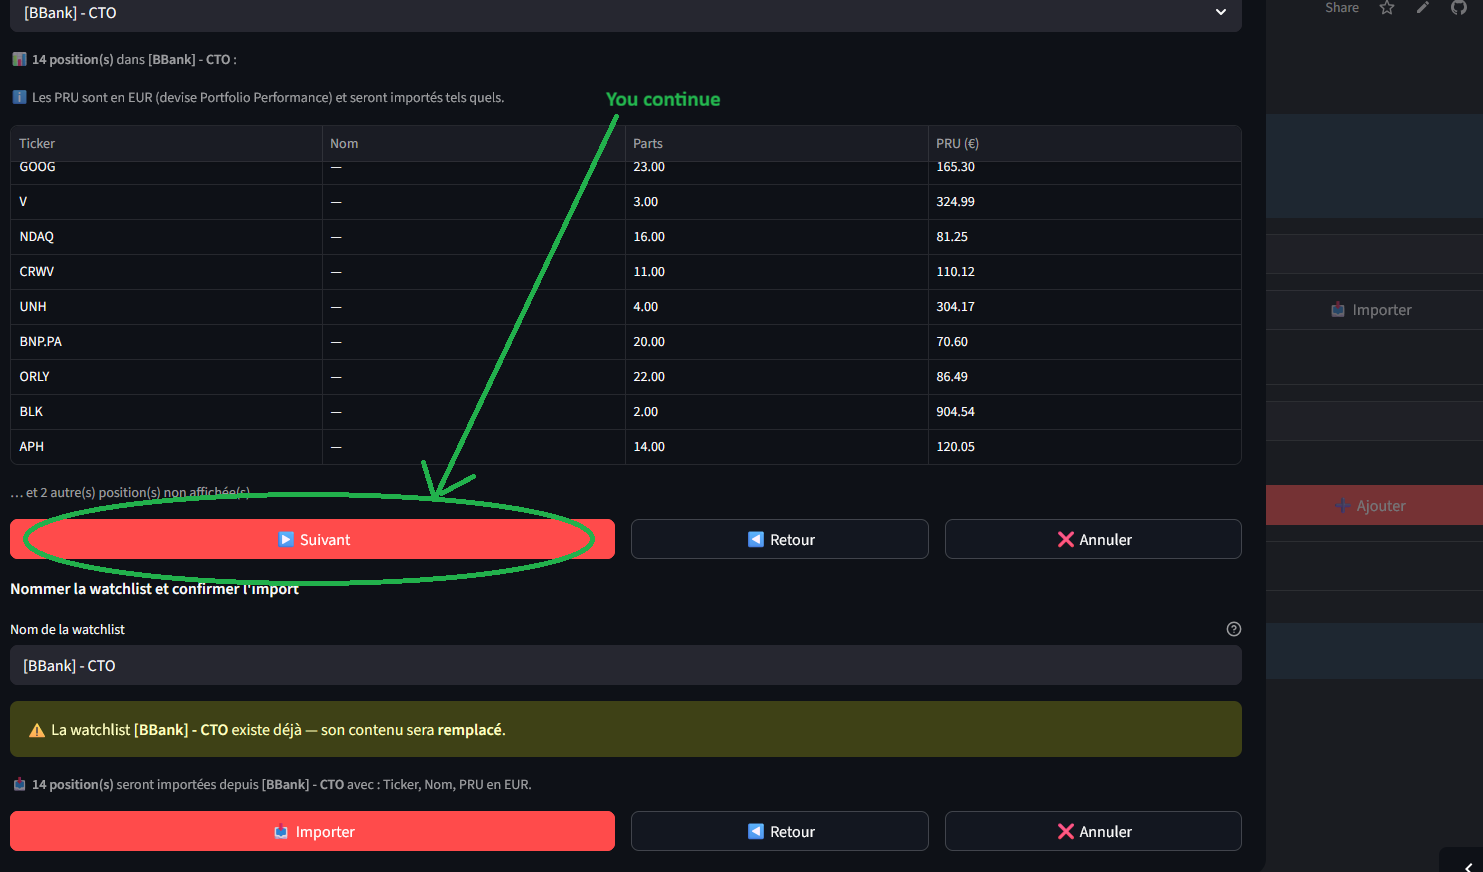
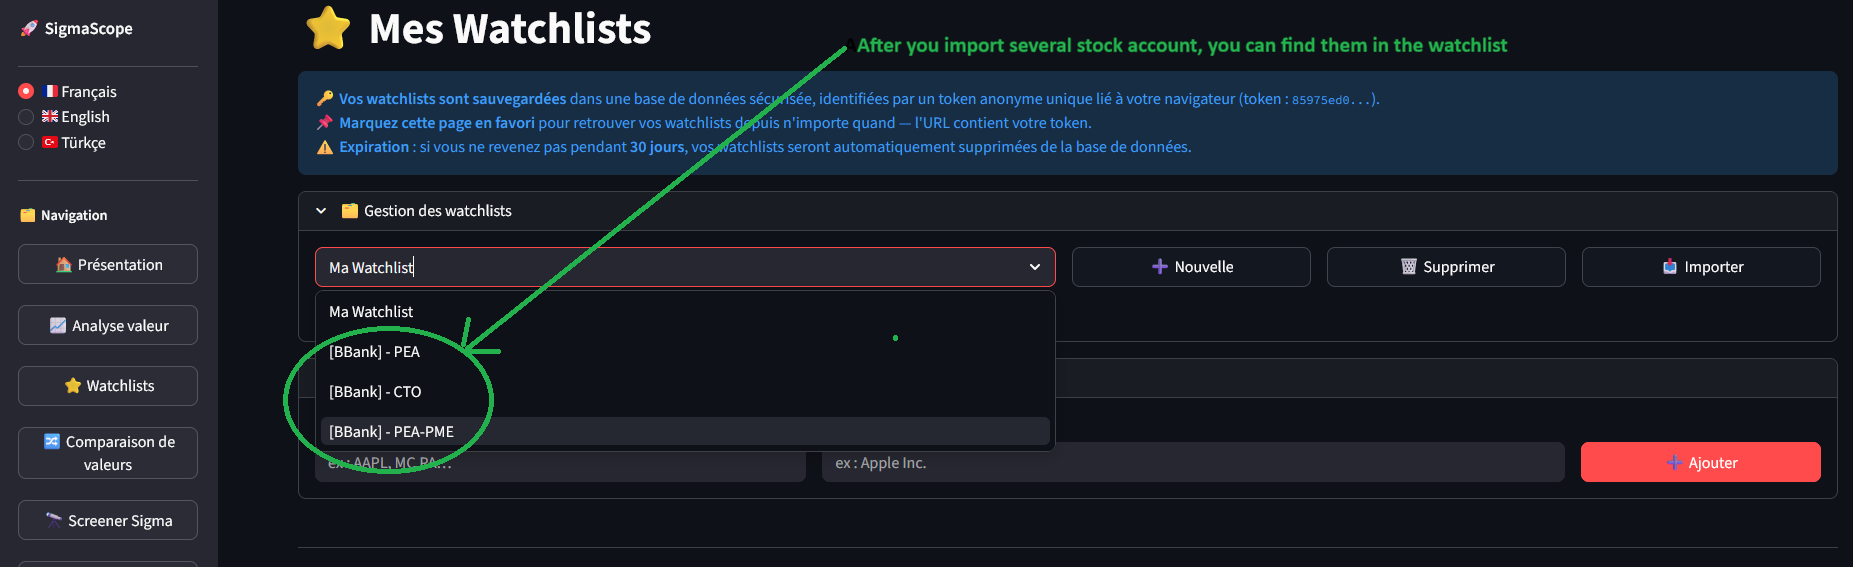
Integration with Portfolio Performance
The tool allows you to directly import your XML export. It automatically retrieves your quantities and average costs without any manual entry, allowing you to project your personal data onto the regression models.
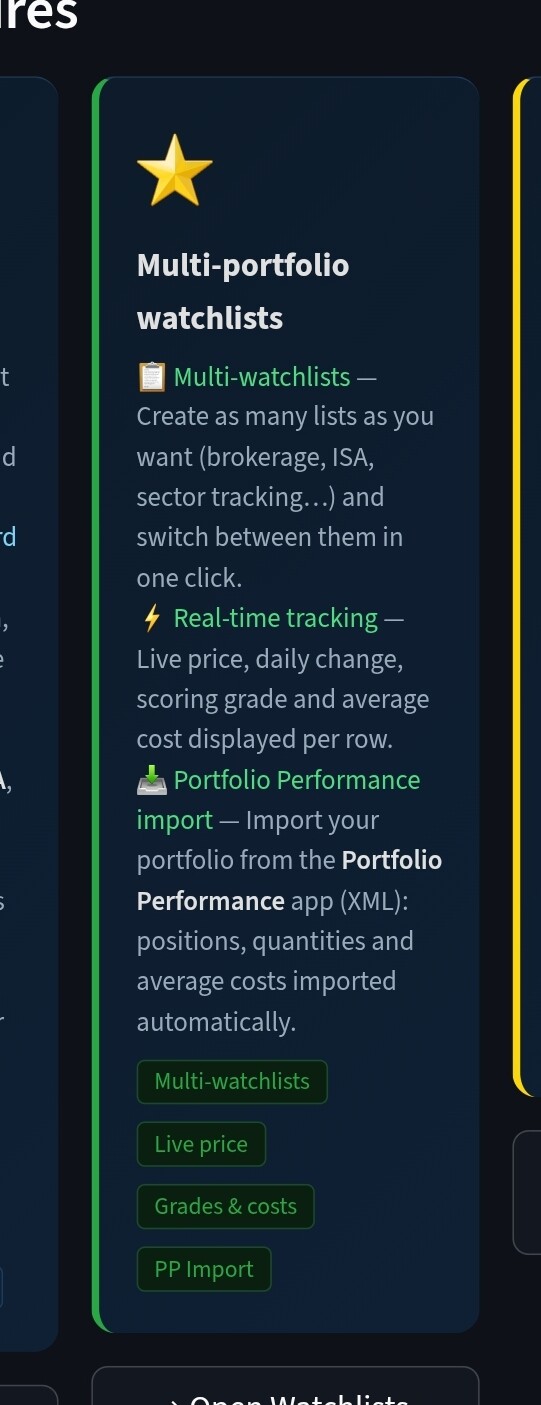
As the project evolved, I added several modules for my own use:
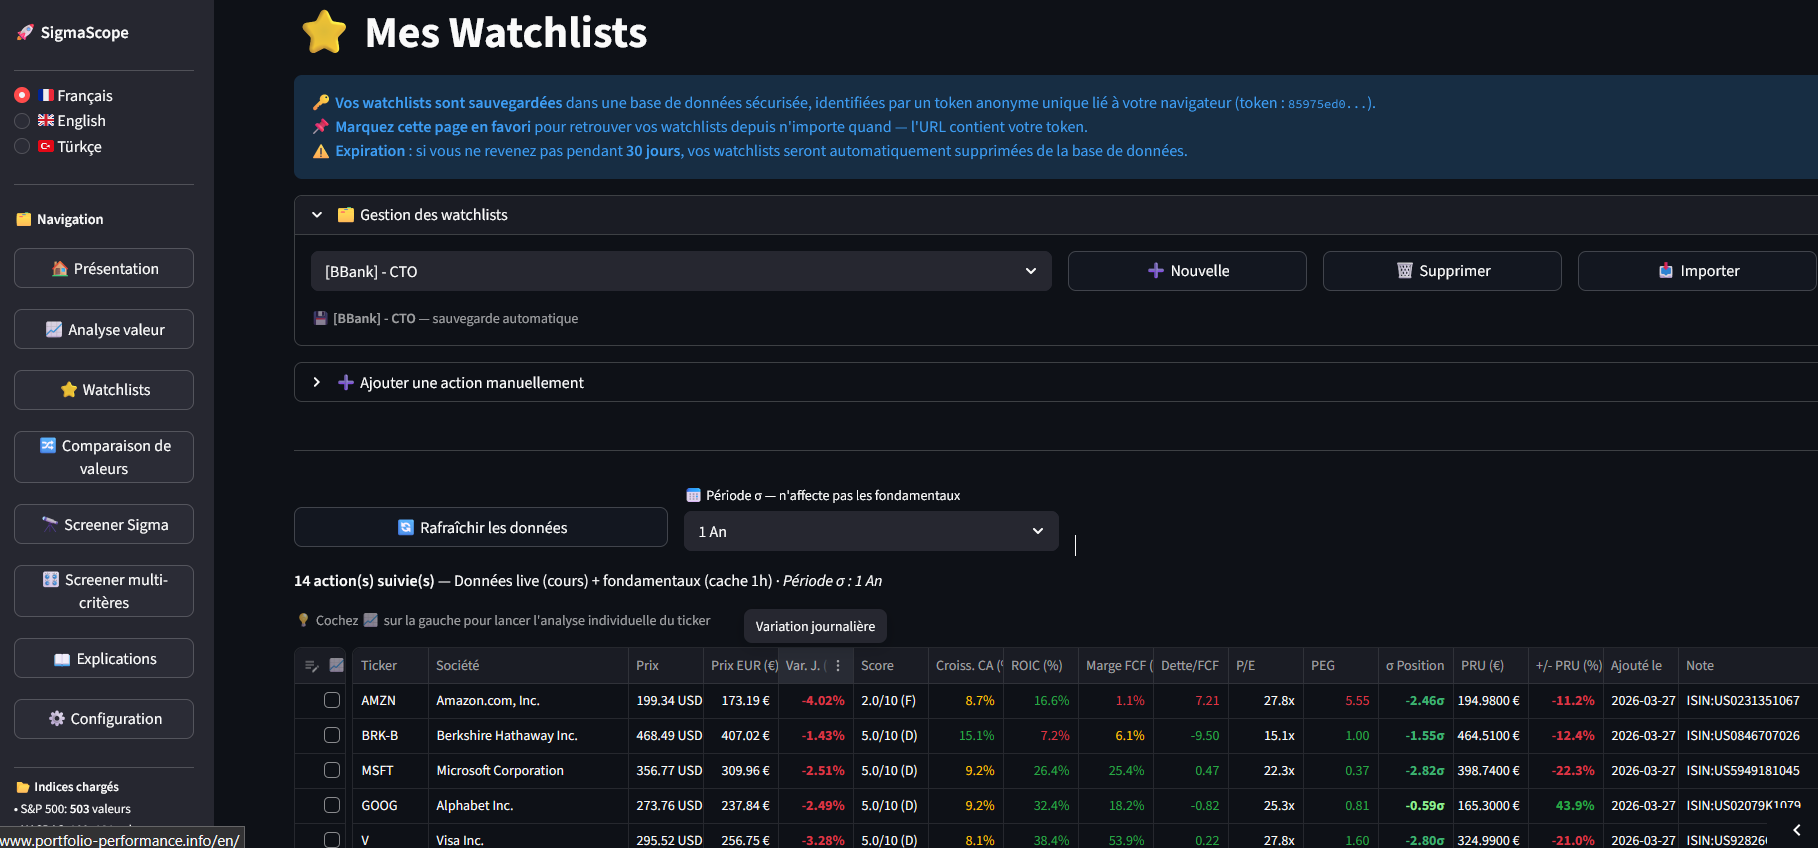
Fundamental Scorecard: A rating (A to F) based on 7 key criteria (FCF, ROIC, Growth, etc.).
Fair Value Calculation: DCF models, Gordon-Shapiro, and historical multiples.
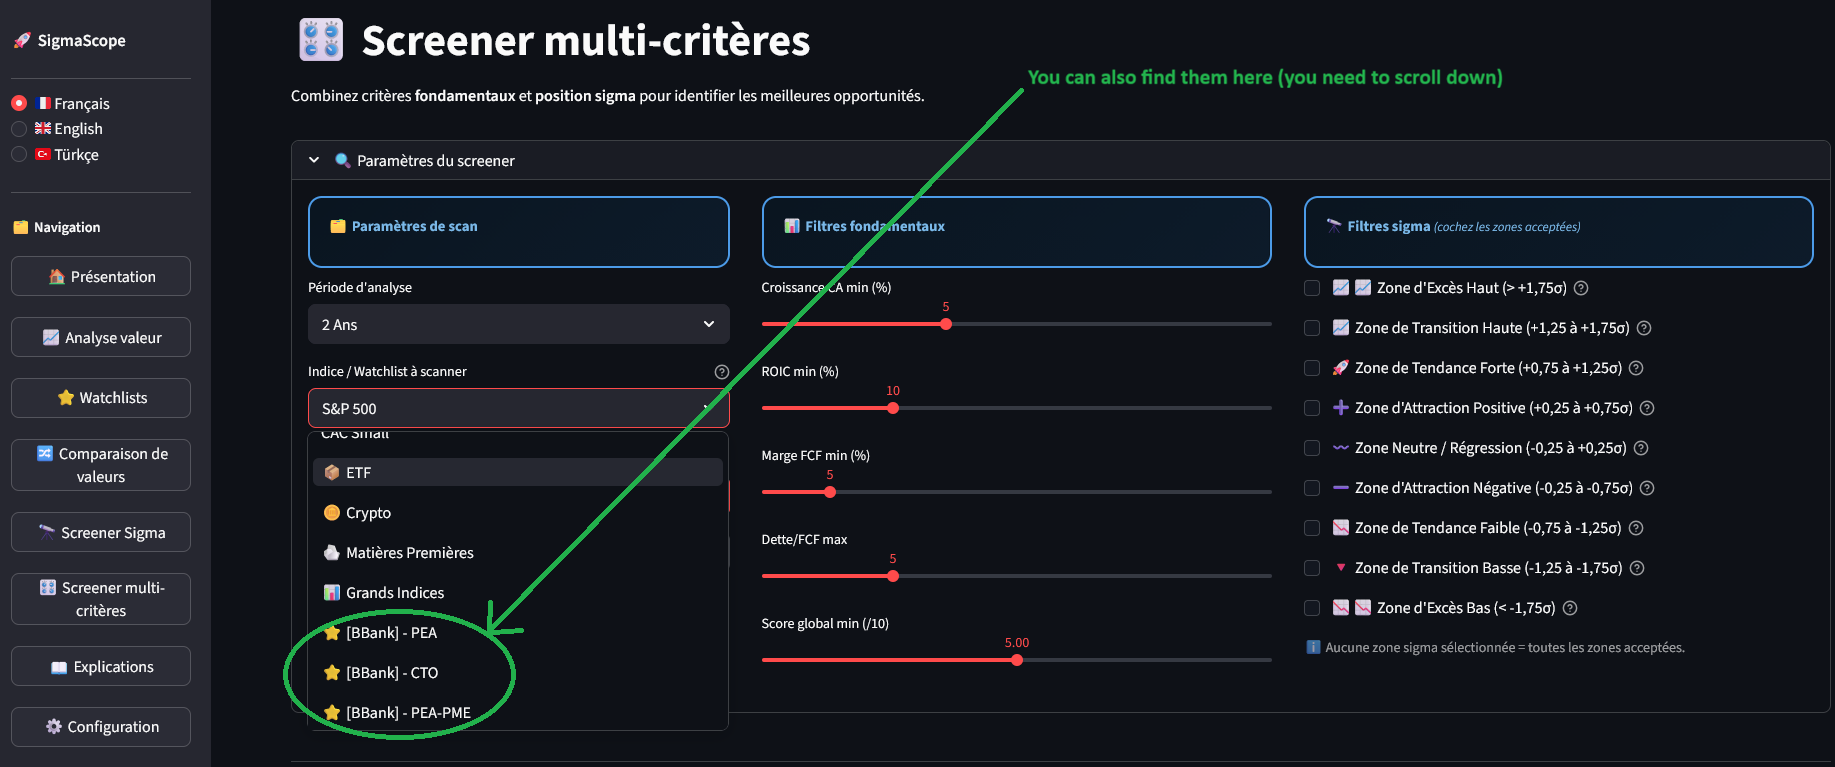
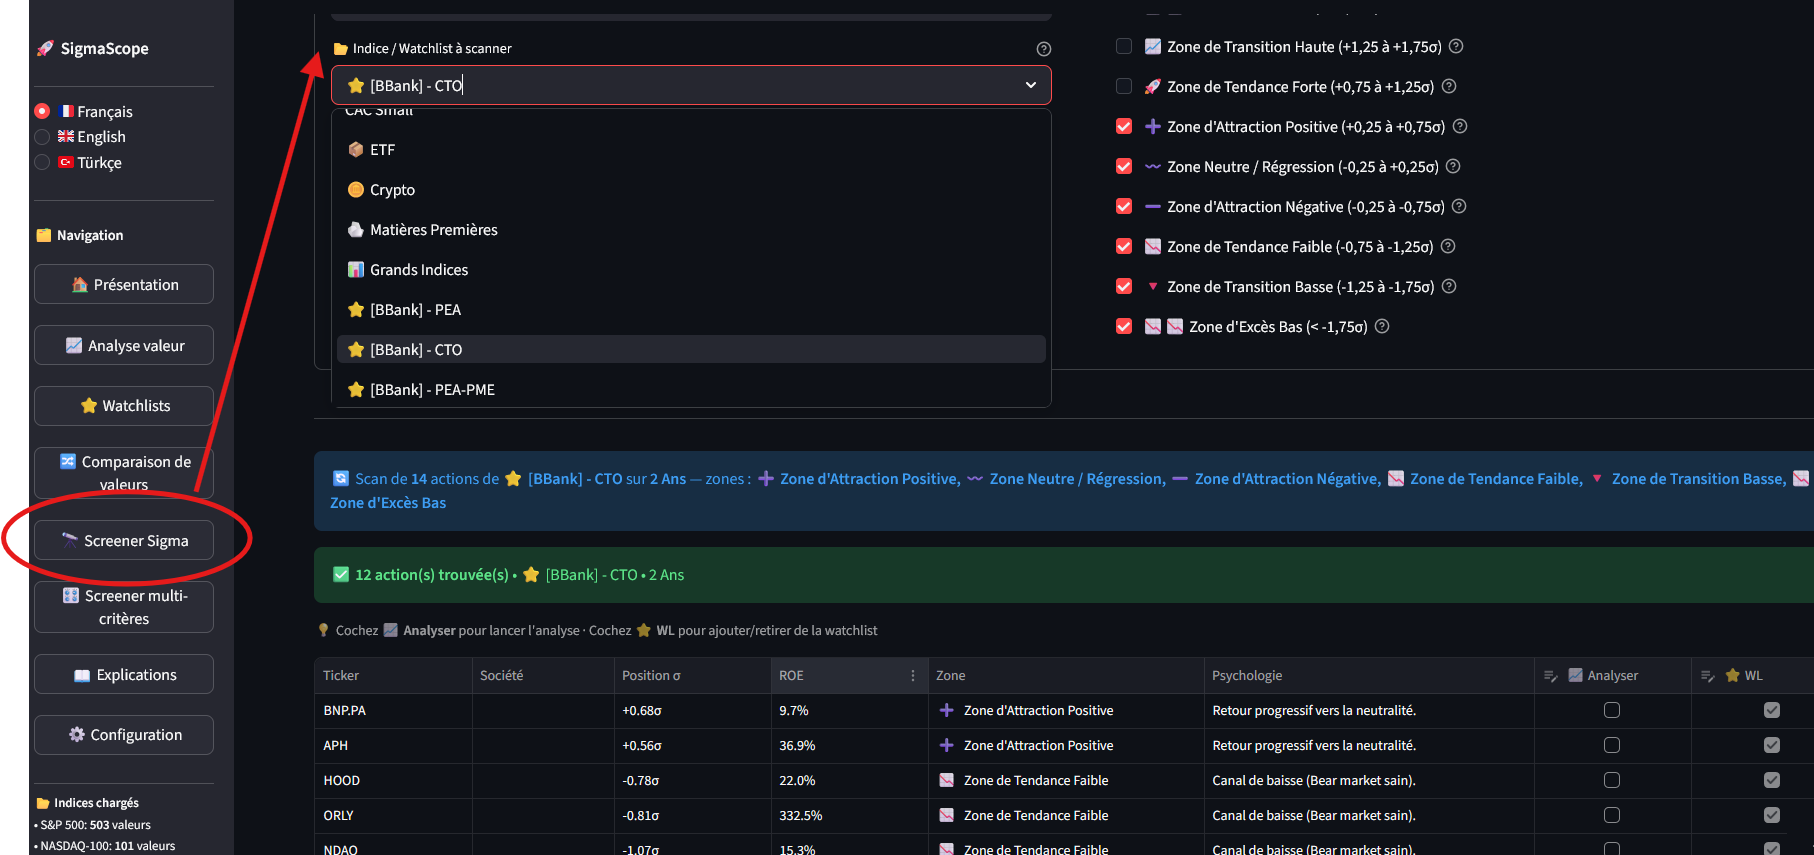
Sigma Screener: A scanner to identify stocks in statistical opportunity or overheating zones across full indices.
[Image 3: Screener sigma 1.png — The market scanner] [Image 4: Watchlist 2.png — Scoring details and analysis]
Project Status & Future Improvements
The project is still under active development and there is a lot of room for improvement (yfinance data retrieval speed, ratio precision, UI tweaks, etc.). It’s a “sandbox” project that evolves according to my needs as an investor.
If you’d like to test the tool with your own export or just explore the charts:
httpx.ConnectError: This app has encountered an error. The original error message is redacted to prevent data leaks. Full error details have been recorded in the logs (if you're on Streamlit Cloud, click on 'Manage app' in the lower right of your app).
Traceback:

File "/mount/src/sigmascope-portfolio-performance/SigmaScope_v1.py", line 2920, in <module>
    all_data_extended = get_all_data_with_watchlists(all_data)
File "/mount/src/sigmascope-portfolio-performance/SigmaScope_v1.py", line 1499, in get_all_data_with_watchlists
    for wl_name in load_wl_index():
                   ~~~~~~~~~~~~~^^
File "/mount/src/sigmascope-portfolio-performance/SigmaScope_v1.py", line 158, in load_wl_index
    .select("name").eq("user_id", user_id).order("created_at").execute())
                                                               ~~~~~~~^^
File "/home/adminuser/venv/lib/python3.14/site-packages/postgrest/_sync/request_builder.py", line 90, in execute
    r = send_with_retry(self.request)
File "/home/adminuser/venv/lib/python3.14/site-packages/postgrest/_sync/request_builder.py", line 51, in send_with_retry
    resp = req.send(headers)
File "/home/adminuser/venv/lib/python3.14/site-packages/postgrest/base_request_builder.py", line 90, in send
    return self.session.request(
           ~~~~~~~~~~~~~~~~~~~~^
        self.http_method,
        ^^^^^^^^^^^^^^^^^
    ...<4 lines>...
        auth=self.auth,
        ^^^^^^^^^^^^^^^
    )
    ^
File "/home/adminuser/venv/lib/python3.14/site-packages/httpx/_client.py", line 825, in request
    return self.send(request, auth=auth, follow_redirects=follow_redirects)
           ~~~~~~~~~^^^^^^^^^^^^^^^^^^^^^^^^^^^^^^^^^^^^^^^^^^^^^^^^^^^^^^^
File "/home/adminuser/venv/lib/python3.14/site-packages/httpx/_client.py", line 914, in send
    response = self._send_handling_auth(
        request,
    ...<2 lines>...
        history=[],
    )
File "/home/adminuser/venv/lib/python3.14/site-packages/httpx/_client.py", line 942, in _send_handling_auth
    response = self._send_handling_redirects(
        request,
        follow_redirects=follow_redirects,
        history=history,
    )
File "/home/adminuser/venv/lib/python3.14/site-packages/httpx/_client.py", line 979, in _send_handling_redirects
    response = self._send_single_request(request)
File "/home/adminuser/venv/lib/python3.14/site-packages/httpx/_client.py", line 1014, in _send_single_request
    response = transport.handle_request(request)
File "/home/adminuser/venv/lib/python3.14/site-packages/httpx/_transports/default.py", line 249, in handle_request
    with map_httpcore_exceptions():
         ~~~~~~~~~~~~~~~~~~~~~~~^^
File "/usr/local/lib/python3.14/contextlib.py", line 162, in __exit__
    self.gen.throw(value)
    ~~~~~~~~~~~~~~^^^^^^^
File "/home/adminuser/venv/lib/python3.14/site-packages/httpx/_transports/default.py", line 118, in map_httpcore_exceptions
    raise mapped_exc(message) from exc
 Why this project?
 Integration with Portfolio Performance

 Added Features (built for the fun of learning)