I know I can do it in the chart, but I would like to see the benchmarks in numbers and not in a graph
Yes, you can assign the performance widgets a benchmark data series, too.
But how? I’m in the Performance (main) tab. I want to see my portfolio’s performance compared to, for example, SP500 during the same time period. I’ve been playing around with the options and can’t find how to do this (it’s only possible for me in the Chart section)
Did you managed anyhow?
could you explain how you did this?
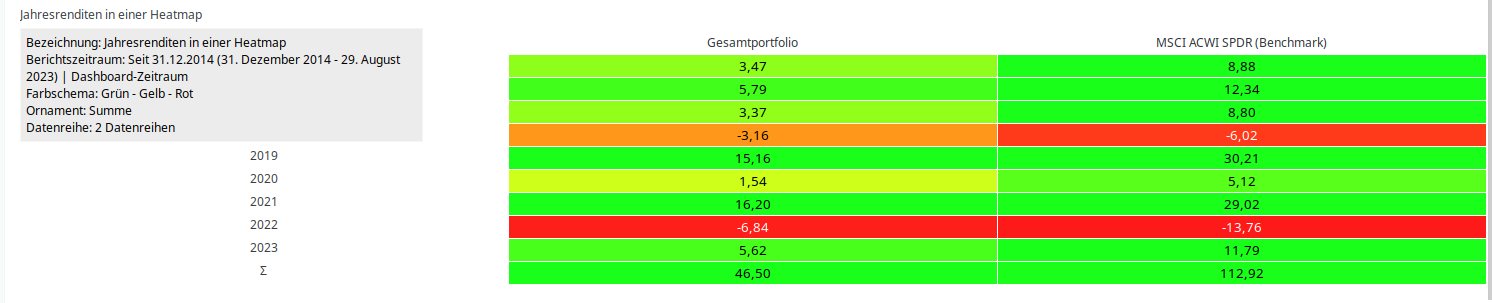
Dashboard / New widget / Performance / Heatmap
That would be nice if it reflected our reporting years. 2024 is 1 Jul 2023 to 30 Jun 2024.
Am I the only one or sometimes is difficult to find some benchmarks indexes?
For example:
MSCI World Growth Net Total Return USD Index
MSCI ACWI Information Technology NR (USD)
MSCI Europe Growth NTR (EUR)
I really struggle to find them. I can find them on Investing.com but then I export manually and import as CSV in the securities…