It is great how you can see your asset allocation. It would be great if it was possible to see how the asset allocation was on a specific time - eg. 2017 - so it is possible to compare.
2 Likes
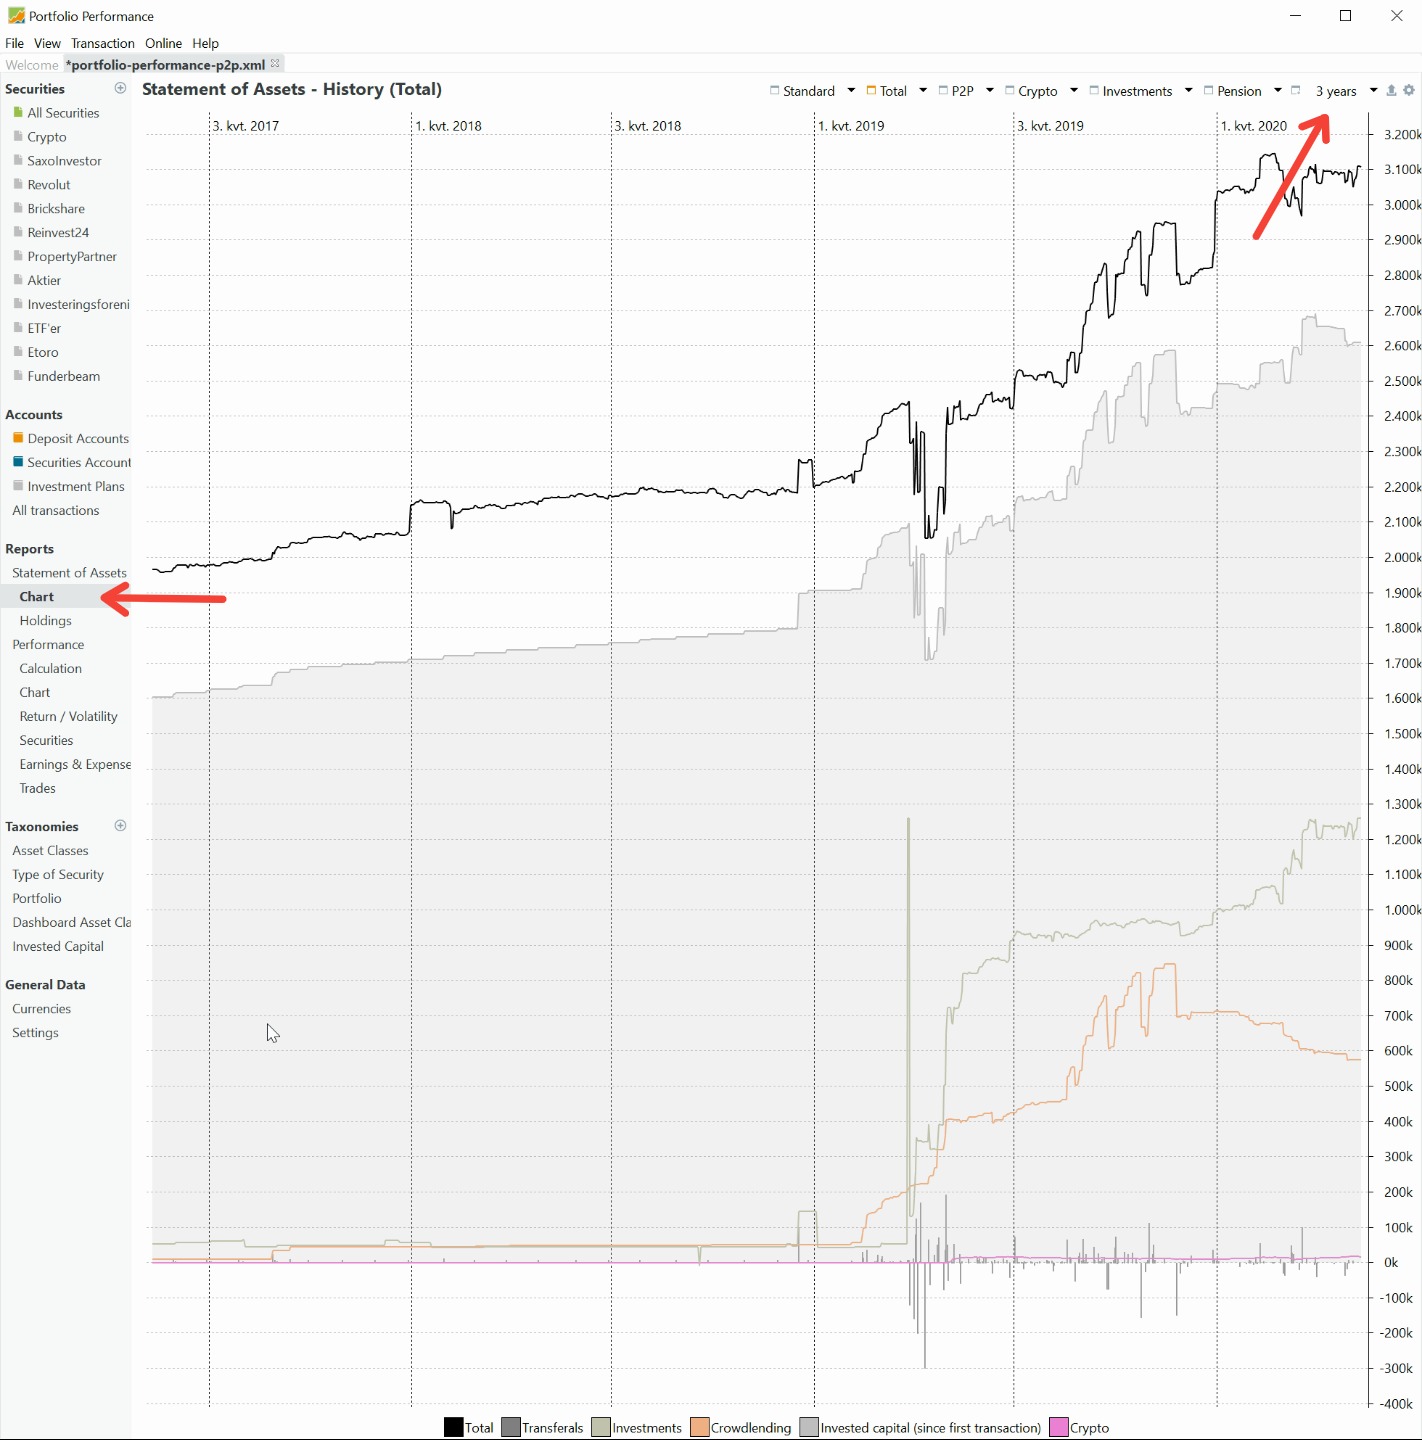
You already can view your statement of assets for any past date, and there is a historical graph for classifications.
Doh. I searched for this for a long time. Where is it?
- Calender symbol at the top of the statement of assets.
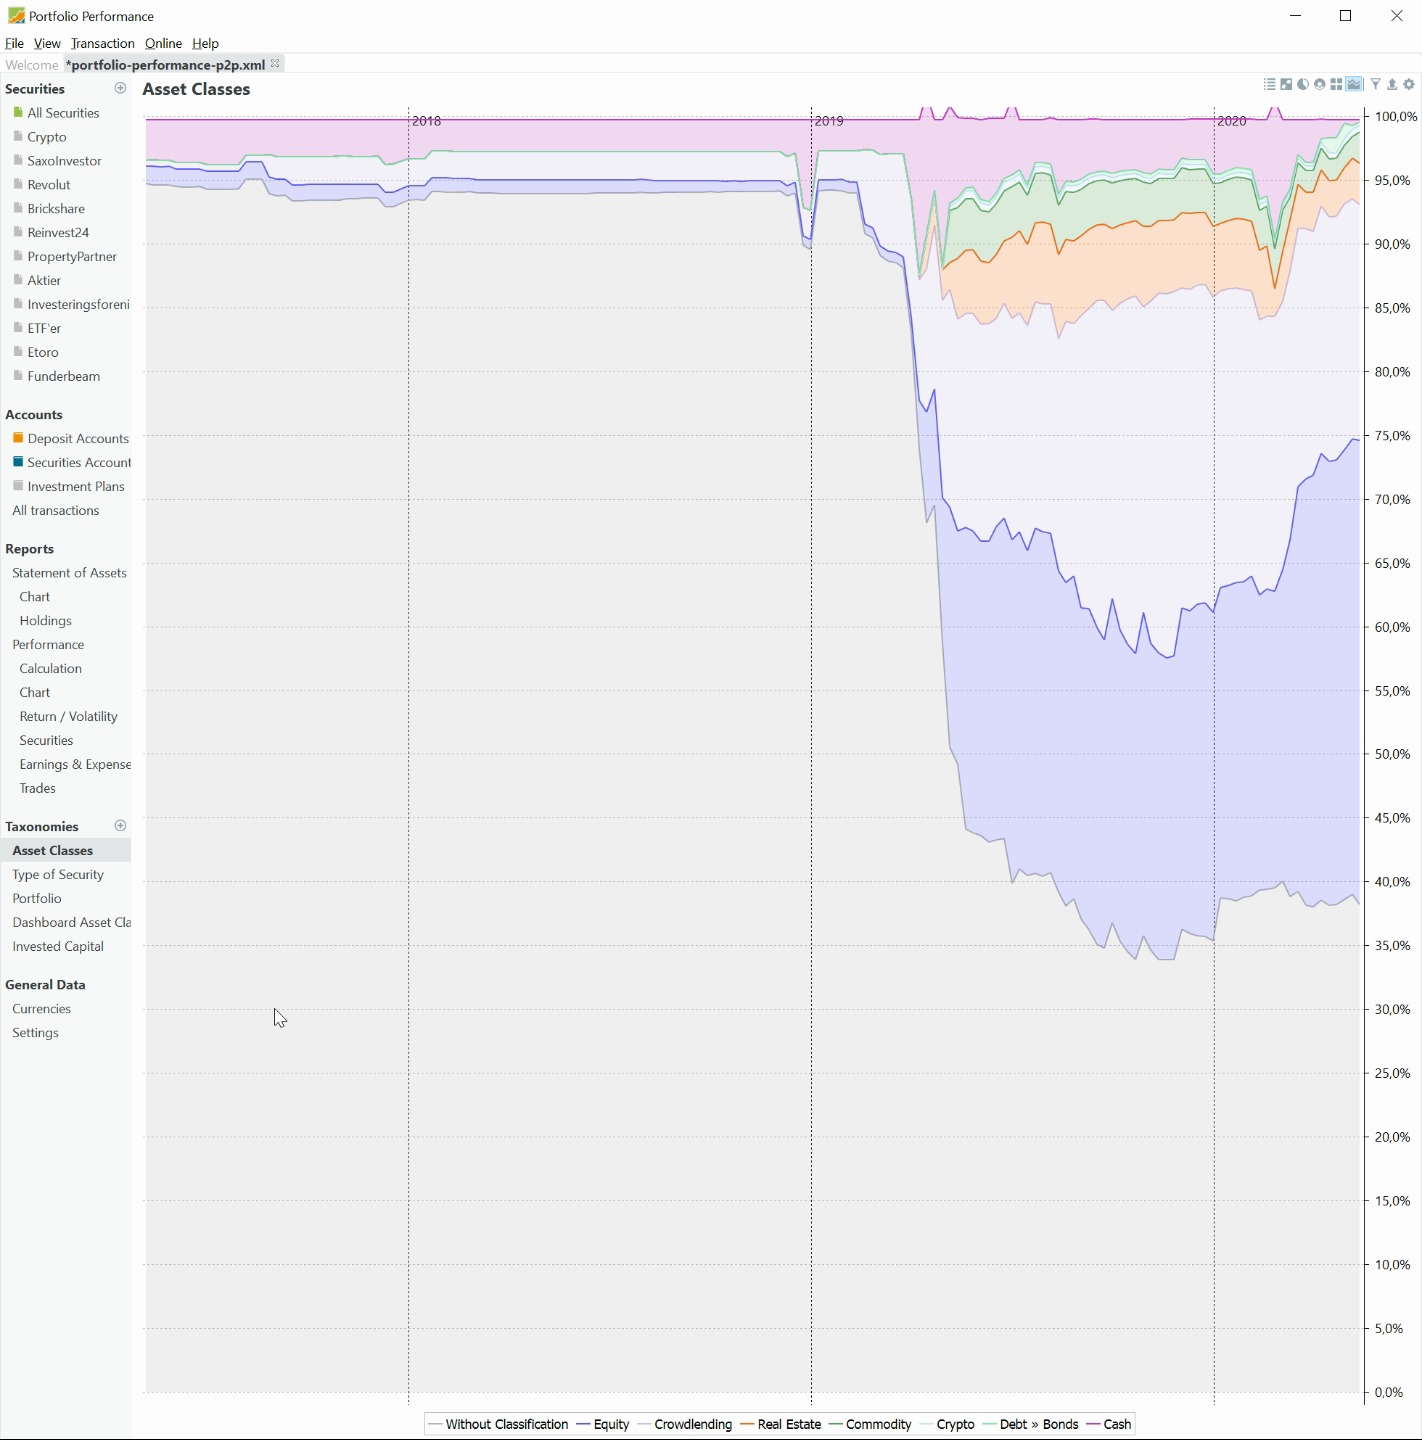
- One of the diagram types (stacked series) selectable also from the top of the classification view.
As far as I can tell from the Statement of Assets, it is not possible to choose different diagram types?
And from the Taxonomy view where you can choose different diagramtypes, it is not possible to choose specific dates?
Maybe I am just not using my eyes properly?
@chirlu Could you help pointing me in the right direction?
I meant the actual statement of assets, not the associated chart. On that page, there is a calendar leaf symbol at the top, which lets you choose a different date for the statement of assets. As usual, it is grouped by the top level of one chosen classification.
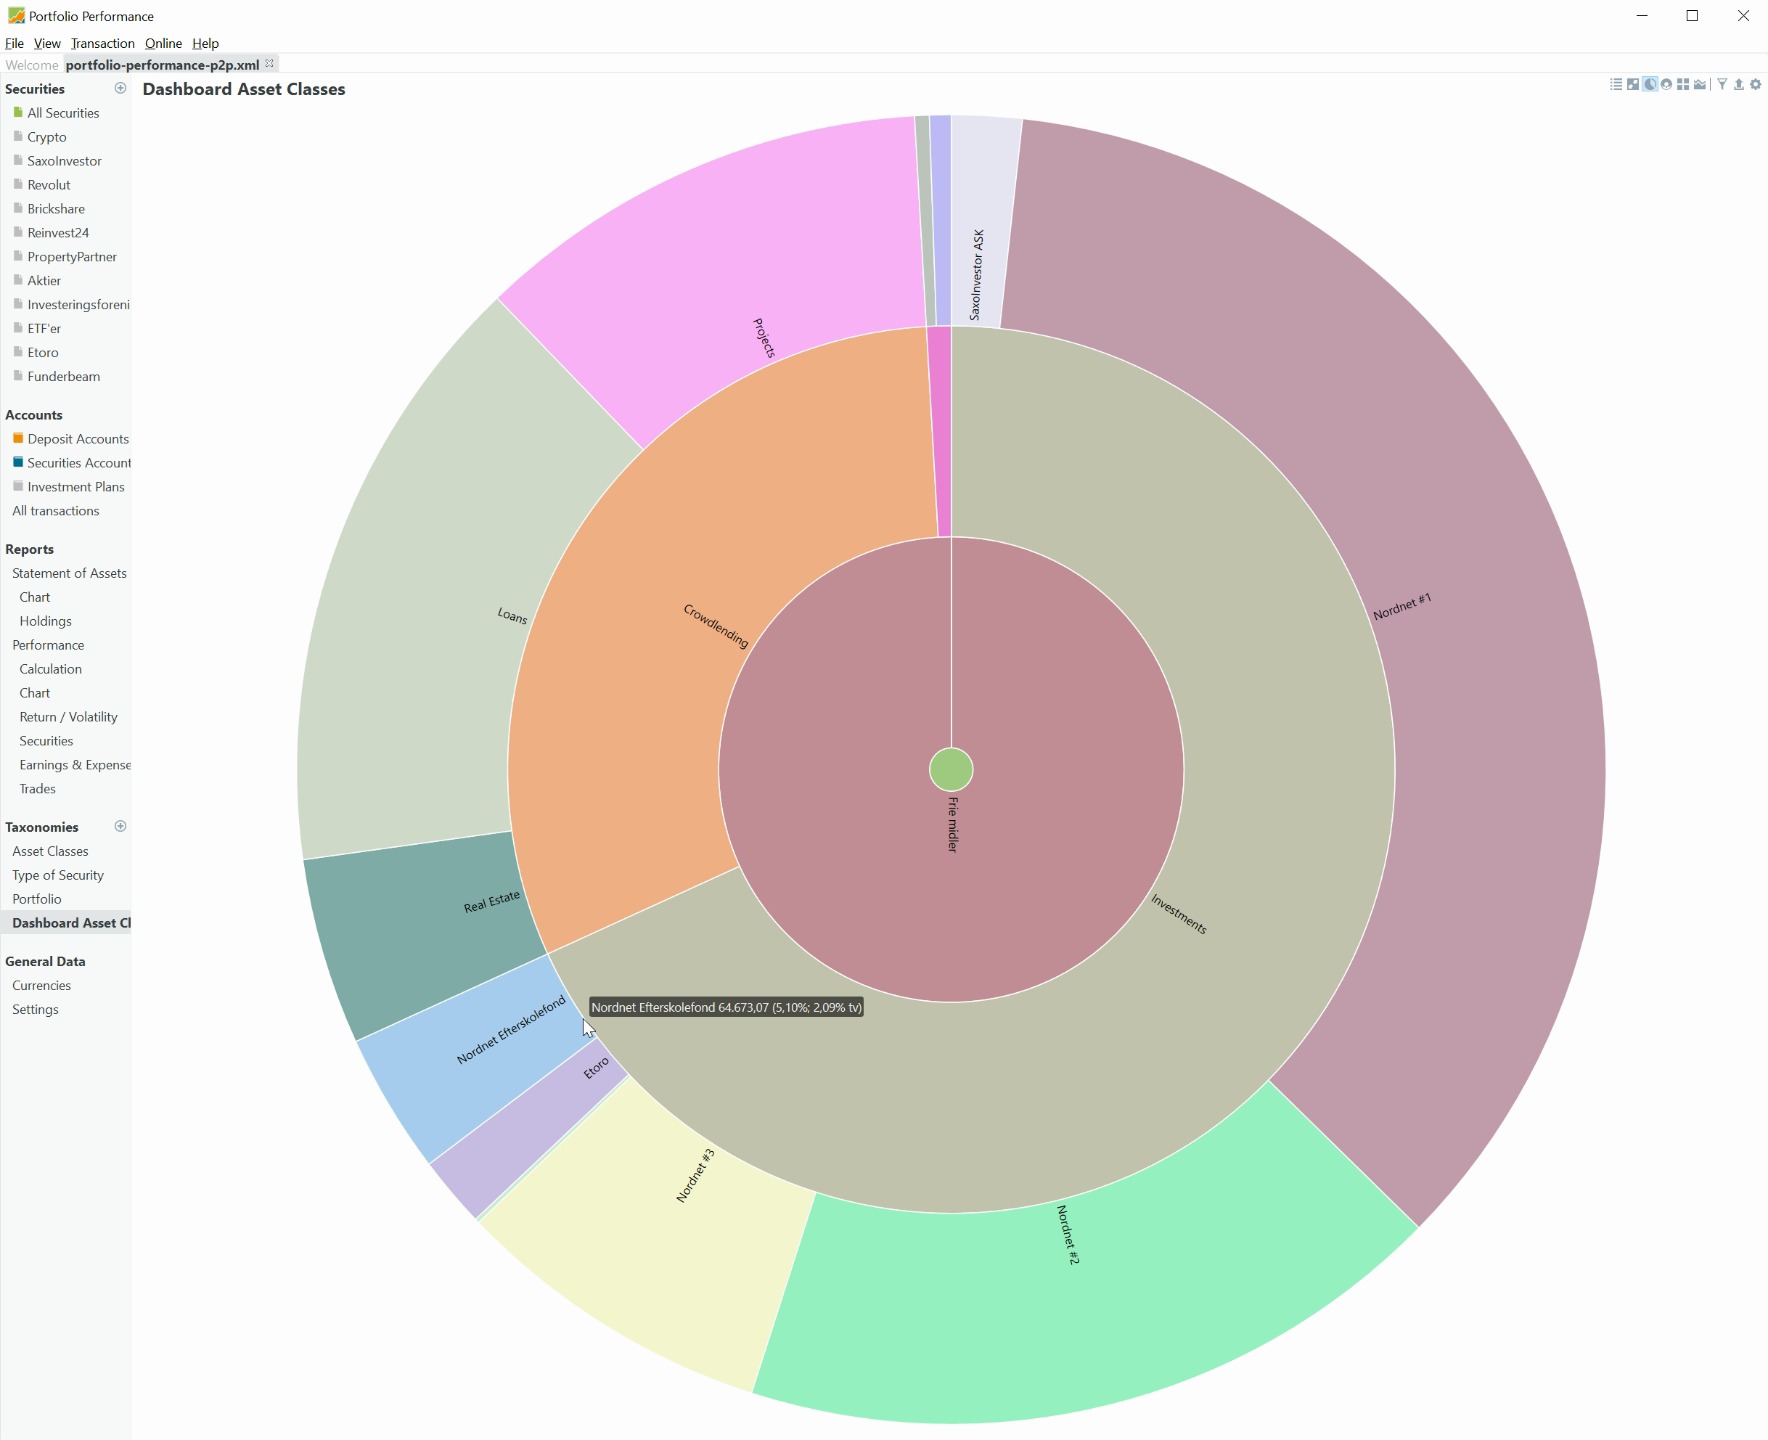
In the taxonomy view, you can get percentages by clicking into the chart. The time period to be shown is global, you can change it on some other pages.
@chirlo I found the calendar on the Statement of Assets.
I was looking for a visual representation of the allocation, like you can get on the taxonomy pages.
You write
„In the taxonomy view, you can get percentages by clicking into the chart. The time period to be shown is global, you can change it on some other pages“.
Where do you change the timeperiod for the Taxonomy overview pages and attached diagrams?
I don’t think that is possible for past dates.
Only for the stacked series. For that, everywhere where you can change the reporting period.