Hello, and thank you for your detailed reply. I hope someone can integrate the new features into your script, it wouldn’t be a bad idea also to do it directly in PP.
Hi @Alfons1Qvor12,
Thanks a lot for this tool!
It took me a while to get Python and Git set up, but it was totally worth it.
For me… it really adds a lot of value to PP!
Just tried it with the Top 100 holdings…
It’s great to have the information in PP, but as you said, it get’s a little messy. At least in the holding-charts.
Would the following be feasible without too much trouble?
With the argument “-top_holdings 100”, your classifier will create the following classifications in the XML file:
- Holding [Top 10]
- Holding [Top 25]
- Holding [Top 100]
(from 10 to the number specified in the argument - in the steps allowed by the tool [10, 25, 100, 1000, 3200])
This way, all the information would be in PP and you can pick the level of detail you want to see.
e.g. you can analyse the details in the classification-definition (“Definition der Klassifizierung”) of “holding [Top 100]” and look at the charts (e.g. Kreisdiagramm) for “holding [Top 10].
Would be great!
But anyway… thanks again for the tool!
Cheers,
fdswe
1 Like
OK, now I understand the last part of the sentence.
With the Top 3200 holdings, PP doesn’t open the edit-dialog (Ctrl + E) for an World-ETF anymore (had to kill the PP-tasks).
I guess the tab “Taxonomies” in the edit-dialog would need to load too much data and just breaks (at least on my not very powerful Windows PC).
What a bummer! ![]()
fyi - Some test results (% without classification for World ETF IE00B4L5Y983):
- Top 3200 → 0,3% without classification → Edit dialog doesn’t open
- Top 1000 → 3% without classification → Edit dialog doesn’t open
- Top 500 → 14,4% without classification → Edit dialog opens but takes too long
- Top 300 → 24,3% without classification → Edit dialog opens but takes too long
- Top 250 → 28% without classification → Edit dialog opens but takes long
- Top 100 → 45% without classification → works fine (on the slow side)
- Top 10 → 72% without classification → works fine
(3 tiny code adjustments to test with 250, 300 and 500 holdings)
Edit:
To be fair… other tools also just show the top 100 holdings.
e.g.
- https://app.holistic.capital/ (“x-ray” is a free feature)
- Parqet X-Ray: Asset-Allocation unter Berücksichtigung von ETFs (not tested, as not free)
(“Um die Übersichtlichkeit zu wahren, haben wir in der ersten Version von Parqet X-Ray ein Limit für die Top 100 Assets eingebaut. […] Für Nutzer, die sich vollständig in die Daten vertiefen möchten, bieten wir zusätzlich einen CSV-Export an, in dem alle Anteile ohne Einschränkung dargestellt werden.”)
Hi,
My experience: As long as you don’t open the edit-dialog (Ctrl + E), PP is able to manage large number of holdings. I use it regularly even with top 3200 holdings (e.g. in Statement of Assets or for exporting Statement of Assets), but aftwards I usually fall back to lower numbers again to keep the file manageable.
I undestand your idea and will consider such option in future, but for the moment, I would recommend that you run the script multiple times and after each run rename the taxonomy Holding into e.g. “Holding [Top 25]” to preserve the result of the previous run.
OK, thanks for considering!
I run the script with the various top-holding arguments and exported/imported the taxonomies in my main-Portfolio. Worked as well.
Thanks a lot for the answer and this tool. Now it works ![]() .
.
Hello, it works amazing, thanks a lot.
About the API, I saw that there is a python library for the morningstar api called mstarpy, maybe that helps? I’m posting it here as the issues are closed on the repo.
Also, I was wondering if it would also be possible to include adding the Total Expense Ratio for each fund into this tool? I saw that the api in theory offers it and it would be really neat.
e.g. with the lib could look like this. (also see this jupyter notebook)
import mstarpy as ms

funds = ms.Funds("IE00B1FZS350")

funds.feeLevel()["prospectusExpenseRatio"]
Sorry that I did not just do a pull-request but the xml stuff looks quite complicated ![]()
Hello @lucas2,
I will check and will think about providing the information in the text output of the script. However, I don’t have plans to update such information in the xml file directly. The script does not touch that part of the xml at all at the moment and it would be a bigger task to get this done properly.
We had a similar discussion earlier in this thread about aligning the name of the security with the information from Morningstar.
Actually, I don’t think that this script is the right place to maintain such (more static) information about securities. I would have thought that such this would rather be included in the native functions of PP at some point in time (if it not already is).
1 Like
@lucas2 please try out updated version of new-api-branch. It now displays “Ongoing Charge” as in the following example:
[Xtrackers DAX UCITS ETF]:
@ Retrieving data for fund LU1349386927 from Morningstar API
(Name: “Xtrackers DAX ETF 1D”)
(Ongoing Charge: 0.09%)
(Fund type: “Equity”)
Hope that helps.
1 Like
Hey, yes of course, thank you so much for the detailed answer and the updated script. Actually you totally right that I can just very easily manually copy that data over into pp as its quite static
Hi @Alfons1Qvor12 sorry for my late reply – the country@region works like a charm and I wanted to say thank you! ![]()
I’ve just adapted the json file since I classify them a bit differently (e.g. UK as part of Developed Europe)
1 Like
Hello,
I’d like to share an alternative implementation of Alfons1Qvor12’s Python script. First I want to mention that Alfons1Qvor12 did a great work ![]() and I would not be able to do this without taking his code as example.
and I would not be able to do this without taking his code as example.
I wanted more flexibility around taxonomy customization, which I wasn’t able to implement in Python. So I created a TypeScript / Node.js rewrite, with some additional features:
New features
-
External configuration file with defaults and user customisation
-
Hierarchical taxonomies (e.g. “Europe > Germany”)
-
Nested taxonomies: you can “attach” the Stock Style taxonomy to the Stock category of Asset Type
Examples
- Hierarchical taxonomy example
- Nested taxonomy example
- Customisation config file example
{
  "mappings": {
    "AssetTypeMap": {
      "1": "Actions",
      "3": "Obligations",
      "5": "Obligations",
      "6": "Obligations",
      "7": "Liquidités & équivalents",
      "8": "Autres",
      "99": "Autres"
    }
  },
  "taxonomies": {
    "asset_type": {
      "active": true,
      "name": "Classes d’actifs",
      "stockConfig": {
        "value": "Actions"
      }
    },
    "region": { "active": false },
    "country": { "active": false },
    "country_by_region": { "active": true },
    "stock_style": { "active": false },
    "stock_sector": { "active": true },
    "bond_sector": { "active": false },
    "holding": { "active": false }
  },
  "embeddedTaxonomies": {
    "stock_style_in_asset": {
      "active": true,
      "parentCategory": "Actions"
    },
    "bond_sector_in_asset": {
      "active": true,
      "parentCategory": "Obligations"
    }
  }
}
Please note that I do not plan to work on Vorabpauschale or other German-specific features that I don’t fully understand.
As usual, the implementation is available on GitHub:
![]() https://github.com/rylorin/pp-portfolio-classifier
https://github.com/rylorin/pp-portfolio-classifier
Feedback is, of course, very welcome!
7 Likes
Hello @rylorin,
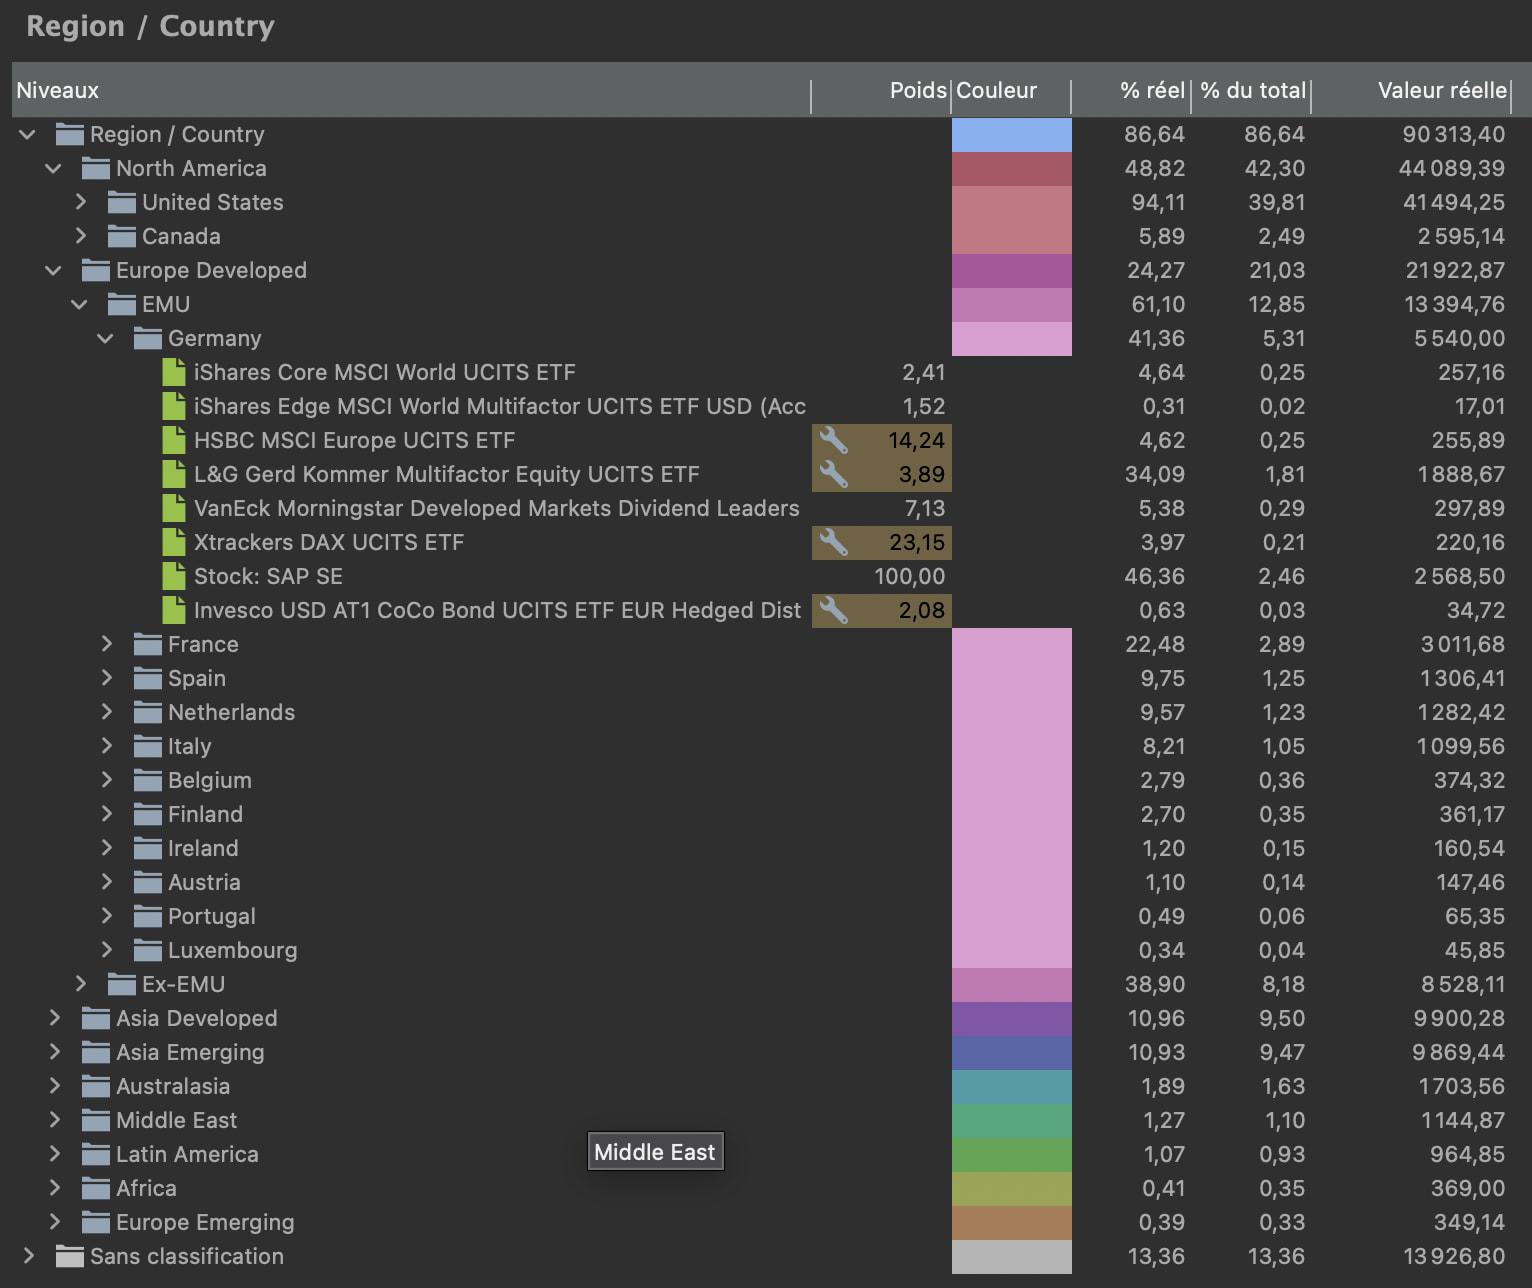
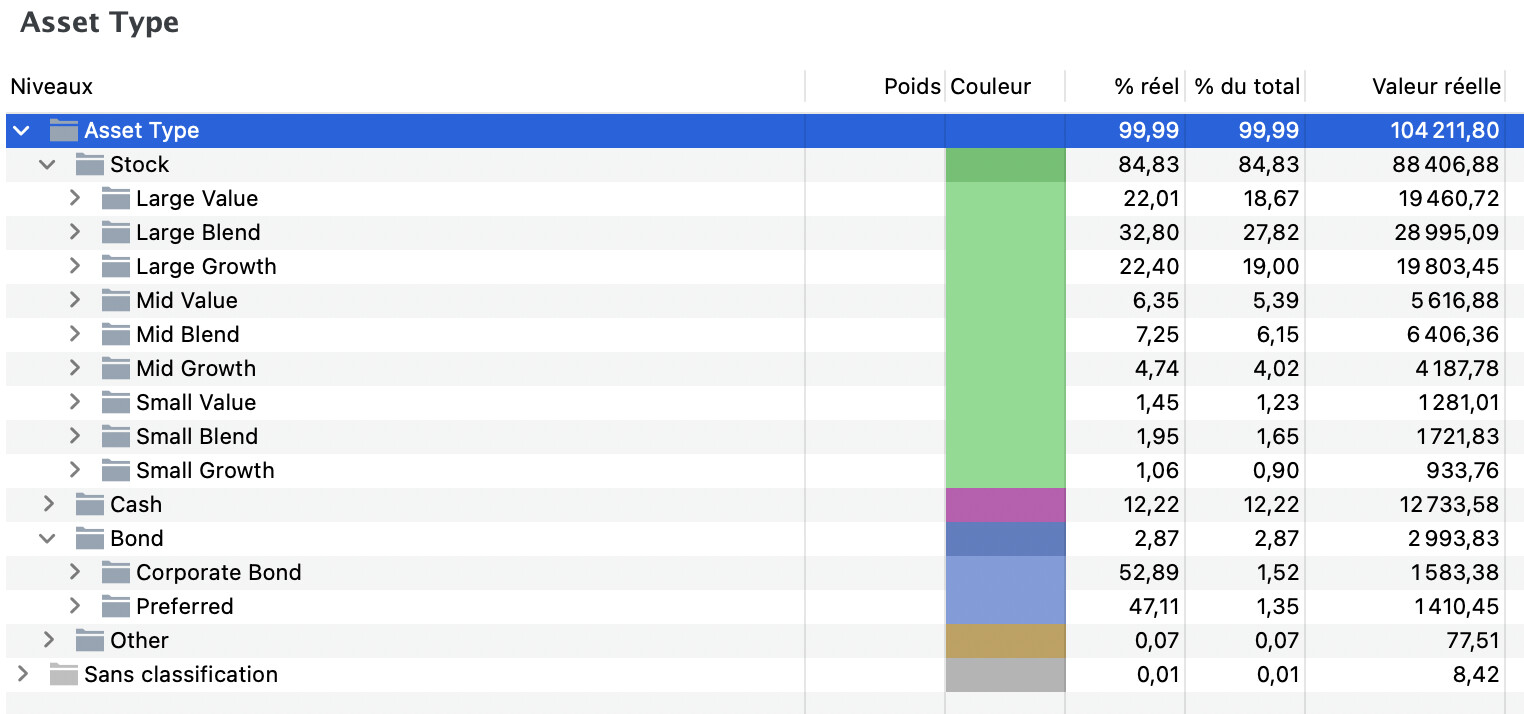
First of all, great work! I really like the customization options and the availability of hierarchical taxonomies. This could save me a lot of time, so I’ve been doing some testing on ISIN=LU2872292243, which is a mixed bond/equity ETF. I have three comments:
First, in config/default.json I noticed the "fixTotal": true parameter in some of the taxonomies, but changing it to false didn’t seem to have any effect on the output. I looked through the code and didn’t find any use of the parameter in any of the calculations. Is that intended, or could you explain what that parameter does? I’m not familiar with typescript, so I may have overlooked something.
Second, after sifting through your and @Alfons1Qvor12’s code, I managed to download the json for the above security from the API. I noticed that in the json, the bond and equity country exposures are reported separately:
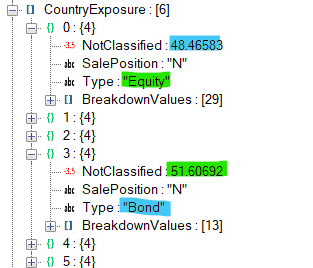
In config/default.json, the country taxonomy has a "filter": { "SalePosition": "N" }, so it adds up the country weights for both bonds and equities to about 200%, before normalizing the sum back to 100%. In this particular case, the error is relatively small, because bonds and equities make up about 50% each, but with deviations from that, the error becomes larger. I can extract the bond and equity country exposures separately by adding the appropriate filters, say "filter": { "SalePosition": "N", "Type": "Bond" } using already available configuration options.
Third, the Breakdowns almost all contain a NotClassified field. This could be used instead of embedded taxonomies to get the overall weights right and save me the necessity of having an additional level in my hierarchical taxonomies. In the example shown above, the 51% NotClassified in the Bond section contains the equities (and others).
Multiply each of the Breakdown values with (1-NotClassified/100) to get the correct overall weight in the security. If a Breakdown doesn’t contain the NotClassified field, just set it to 0. It would be great if the use or not of this parameter were configurable in config/default.json for each taxonomy, in case anybody wants to embed different taxonomies. This unfortunately requires some additional coding, which I am not capable of doing.
For convenience, here is the link to the fund at Morningstar:
https://global.morningstar.com/de/investments/etfs/0P0001UMDA/portfolio
and the json retrieved from the API using the ITsnapshot viewId:
APIresponse_ITsnapshot.json (315,8 KB)
just in case anybody wants to look up what other information can be extracted using @rylorin’s configuration options.
Hi,
Seems so great for a French user !
I’m stuck with an error at exec :
Error reading XML: Error: Entity expansion limit exceeded: 1070 > 1000
at B.K [as replaceEntitiesValue] ((…)\fast-xml-parser\lib\fxp.cjs:1:27694)
I tried to modify some parameters with Gemini but impossible to fix.
Am I the only one ?
Thanks.
Hello, I have loaded the latest files from the new-api-branch an get errors when I run
python portfolio-classifier.py test/multifaktortest.xml
….
[Stock: NOVO-NORDISK AS B]:
@ ISIN DK0062498333 is a stock, skipping it…
(Name: “Novo Nordisk AS Class B”)
[iShares Edge MSCI World Multifactor UCITS ETF USD (Acc)]:
Traceback (most recent call last):
File “C:\Users\xxxxxxx\AppData\Local\Packages\PythonSoftwareFoundation.Python.3.13_qbz5n2kfra8p0\LocalCache\local-packages\Python313\site-packages\urllib3\connectionpool.py”, line 787, in urlopen
response = self._make_request(
conn,
…<10 lines>…
**response_kw,
)
File “C:\Users\xxxxx\AppData\Local\Packages\PythonSoftwareFoundation.Python.3.13_qbz5n2kfra8p0\LocalCache\local-packages\Python313\site-packages\urllib3\connectionpool.py”, line 488, in _make_request
raise new_e
File “C:\Users\xxxxx\AppData\Local\Packages\PythonSoftwareFoundation.Python.3.13_qbz5n2kfra8p0\LocalCache\local-packages\Python313\site-packages\urllib3\connectionpool.py”, line 464, in _make_request
self._validate_conn(conn)
…
and many more. Any ideas?
Hi,
Did it work before? Does it work with other ISINs? Or is this a general issue of your environment? I would suspect the latter and it looks like some general network issue when using urllib3.
Some thoughts:
-
You can always try to delete cache.sqlite, but I don’t expect that this will solve the issue.
-
I assume that you have installed requirements.txt so your python environment should be ok. You can try to run it in a virtual environment to be sure:
Runpython -m venv ppc-env(ppc-envis then the name of the new virtual environment).
Runsource ppc-env/bin/activateto enter the virtual environment.
Runpip3 install -r requirements.txt
Use the script.
When done, exit the virtual environment withdeactivate. -
Are you behind a corporate proxy? Does zscaler run on your machine? If yes, try to connect from home. Disable zscaler.
-
Ask the search engine or AI chat of your preference to resolve the error messages and their root cause

1 Like
cach.sqlite deleted, requirements installed and met, no proxy, no zscaler.
Is it possible, that the Morningstar server is rejecting/closing requests, when a certain number of API calls have been made? I get the connection error:
requests.exceptions.ConnectionError: (‘Connection aborted.’, ConnectionResetError(10054, ‘Eine vorhandene Verbindung wurde vom Remotehost geschlossen’, None, 10054, None))
I don’t know, if it makes a difference, but try retrieving the authentication token from another domain by using -d option. For example -d fr or -d it or -d es or -d dk.
(I will try to reproduce your issue by running the script many times, but I haven’t hit any such limit yet).
1 Like
I think, the issue was in my environment. What python version have you tested the script with? I’m running now 3.14.3.
I did a re-install of python and various modules and now the script runs again.
Is there a way to test what info comes back from the API? If I’m looking for ISIN IE00BKS7L097 the script says:
[IVZ S&P 500 SCRD & SCRND-ACC]:
@ Retrieving data for fund IE00BKS7L097 from Morningstar API
(Name: “Invesco S&P 500 Scored & Scrn ETF Acc”)
(Ongoing Charge IE00BKS7L097: 0.09%)
(Fund type: “Equity”)
Warning: Percentages not found for ‘Stock Style’ for IE00BKS7L097
Warning: Percentages not found for ‘Stock Sector’ for IE00BKS7L097
Warning: Percentages not found for ‘Region’ for IE00BKS7L097
Warning: Percentages not found for ‘Country’ for IE00BKS7L097
Warning: Percentages not found for ‘Holding’ for IE00BKS7L097
Or does this just mean, there’s no information available?