Average Purchase and Sell for individual TRADES in trades tab

Hi,

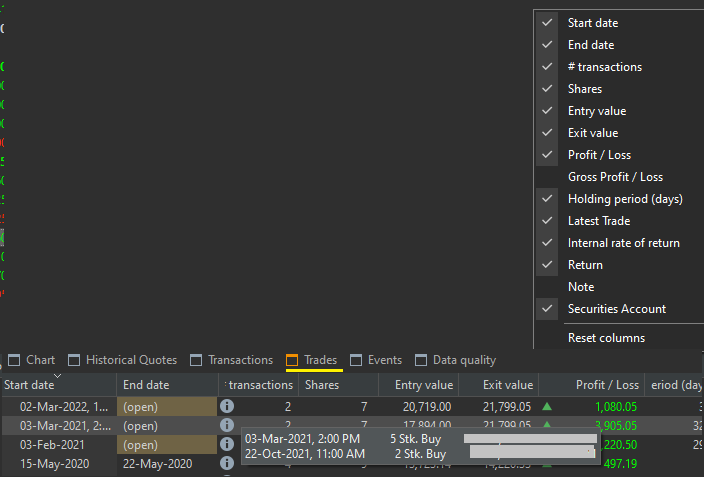
From the image attached below, is there a reason why the average cost of “Purchase” and “Sale” for every matched trade is not available as a separate column.

There are number of shares and total entry or exit value, If there could just be two columns that divide the entry and exit cost by number of shares.
For open trades, Exit will just be open or NA.
It becomes very easy to spot the avg entry and exit on trade basis, so far each time need to export and divide in MS Excel.

The Main menu Trades tab also shows only total entry and exit value, but no avg entry/exit price.

The closest topic I found was this but it did not seem to give an answer

Cost Average per share after selling shares - Deutsch - Portfolio Performance Forum (portfolio-performance.info)

I am sure there must be a reason if someone can shed light.

Thanks.

1 Like

Thanks @Gulfwarden

I dont know if the others understood what i meant. Just a divide of value by quantity to get average price is needed as extra column for buy and sell.
I wish i knew how to do it.

I think it is clear what you want.
average purchase price = entry value / shares
average sell price = exit value / shares

Alas, to do this, it is required to write some Java code - it is not supported today

1 Like

Thanks @anonymous
Yes, that is what i meant. It is usually easy to recall trade by entry and exit rate when looking at simple chart :slight_smile: