I have a set of transactions for Reliance stock, as shown in the table below:
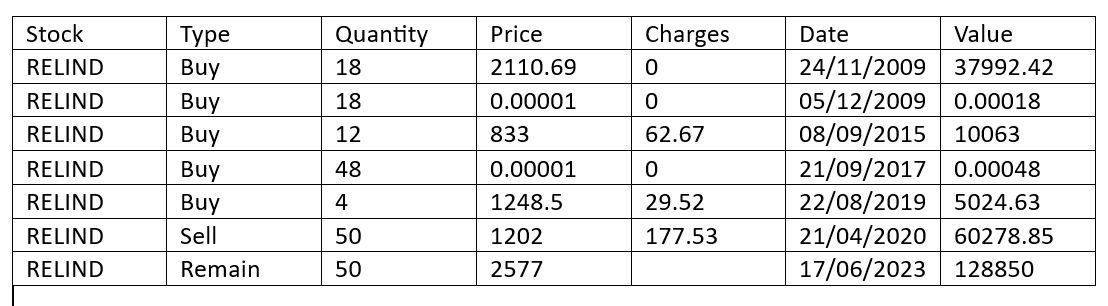
I have analyzed these transactions using three different methods, and I obtained different XIRR (Internal Rate of Return) values.

In Image 1, which is a Google Sheet, I calculated the XIRR to be 12.31% when considering the remaining position and 1.55% when considering the squared-off position.
In Image 2, which is from a portfolio performance software, the XIRR is reported as 2.17%.
In Image 3, which is from a broker terminal, the XIRR is reported as -2.4%.
My main query is why the XIRR values differ across these three methods, even though they use the same set of transactions. I would like to understand how to add these transactions correctly to the portfolio performance software in order to achieve a XIRR value that matches the one from the broker terminal.
I would greatly appreciate your assistance in identifying any mistakes I may have made and guiding me through the correct process. Thank you!