Hallo forum.
I’m new to this software and community.
I’m appreciating the functionality that I’ve discovered and I’m sure that I’ll discover further ones.
Is it possible to add some kind of chart analyses together with the media (SMA and EMA) when I’m watching a particular stock?
Thanks for all and especially for the good translation in Italian of both the software and the statements in the forum.
You can find some info on MACD or RSI in many sites, if I correctly understand your request.
Just two links to wikipedia in English (starting from the historical values, which are yet present in stock graphics by PP, you can calculate and viewing the Moving Average Convergence/Divergence; the same for RSI, Relative Strength Index): MACD RSI
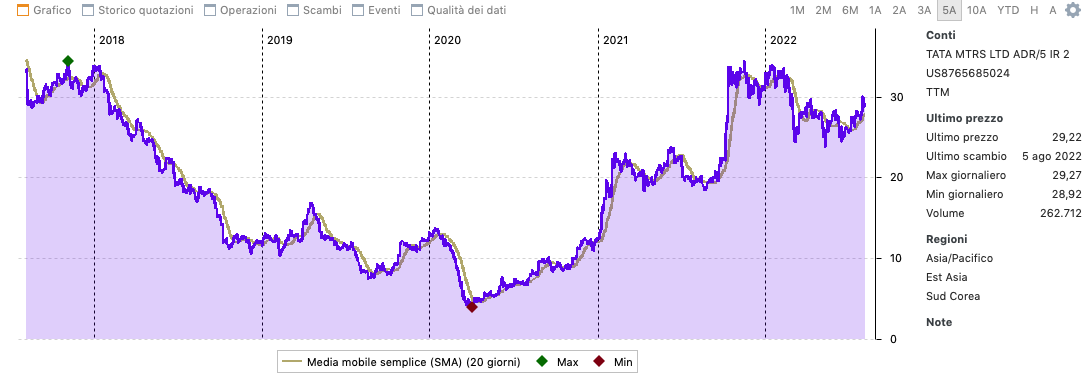
In the following screen shot the graph you can see in PP with SMA