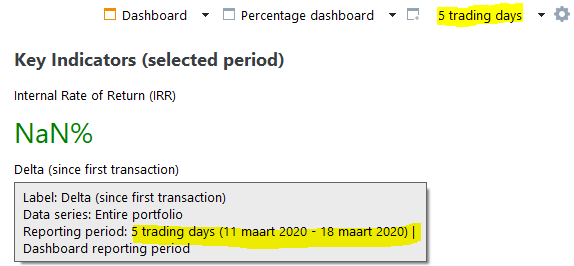
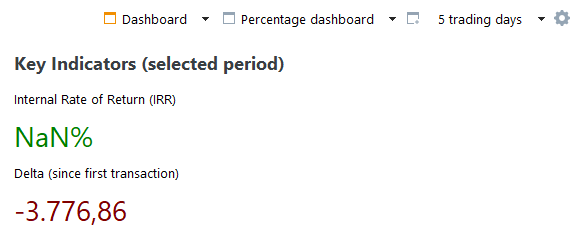
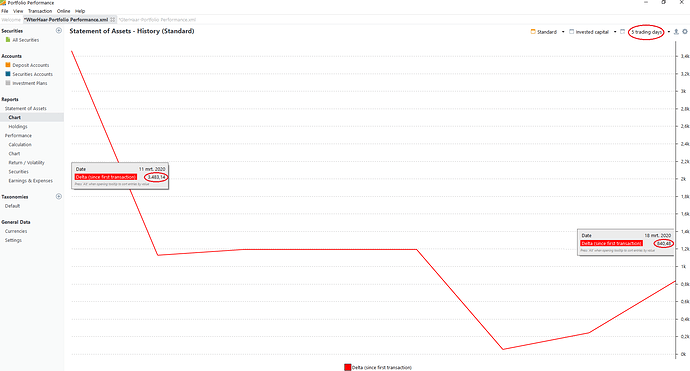
If you plot ‚delta‘ (since first transaction) in a graph on page ‚Statement of Assets‘ > ‚Chart‘ for a specific period it totally differs in actual value compared to the value ‚delta‘ (since first transaction) widget at page ‚Performance‘.
Yes, before we get silly questions. I’ve selected the same period.
For example last 5 days:
11 march: € 3483
18 march: € 840.
Delta: € 840 - €3483 = -€ 2643 and not -€ 3776, unbelievable, what a nasty bug, before v0.45 everything was fine…


