Hi all,
I’ve started using the Portfolio Performance in the last days and I really like it.
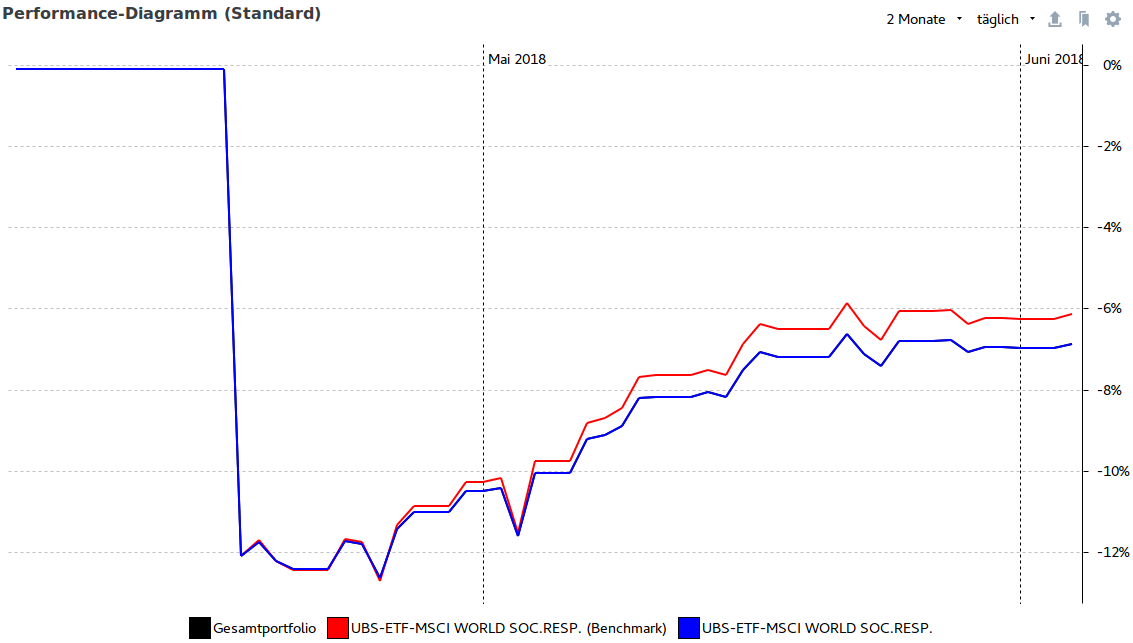
But there is some kind of strange behavior in the Perfromance > Chart view (at least from my point of view). Here have a look:
For now I just have one ETF in my portfolio and I used the same ETF as an benchmark, but there is a difference of nearly 1 %. And there were no dividend payouts during this time. Can someone explain this?
Thanks!
I do not have this bug. Have you checked the historical quotes?
1 Like
It can be different if you a) have fees or taxes in the transaction, if b) the price you paid is not identical to the closing price of the stock or c) if you have dividend payments. (Well, and d) it could of course always be a bug  ).
).
One way to find out where the difference is by exporting the data into CSV (upper right corner) and check on which day the difference starts to show up. What are the transactions there?
If all does not help, send me the sample file to portfolio dot performance dot help at gmail dot com and give me some time before I can have a look at it.