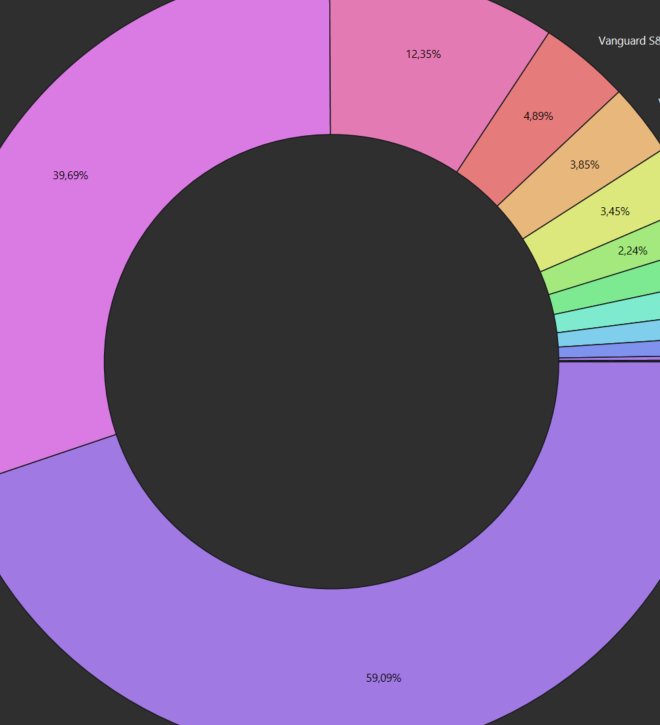
Manual and logic tells me this doughnut should total to 100%. However my 3 largest assets are represented as 59%, 40% and 12%, and then there are another 9 assets that total to another 20%. My Doughnut shows a total of 121%.
As the graph should not ever show >100%, this seems a bug.
Hi Snickers, thank you for your reply. With some guidance I’ll be able to provide more info.
I’m just looking at the standard donut in the menu: reports - statement of assets - holdings. No changes to the standard report so it shows all (positive) assets.
The percentages in this representation add up to 121%, as visible in the screenshot.
They should add up to 100% per Definition: a pie or donut cannot be bigger than itself.
You probably have accounts with negative values. In that case, it is correct that the assets add to, e.g., 120% of the total value. The additional 20% are offset by the credit amount of –20%.