Can you please review what basis the Drawdown calulation is made. Is it calculated from the Statement of Assets chart (i.e. Equity values) or from the Performance chart (i.e %).
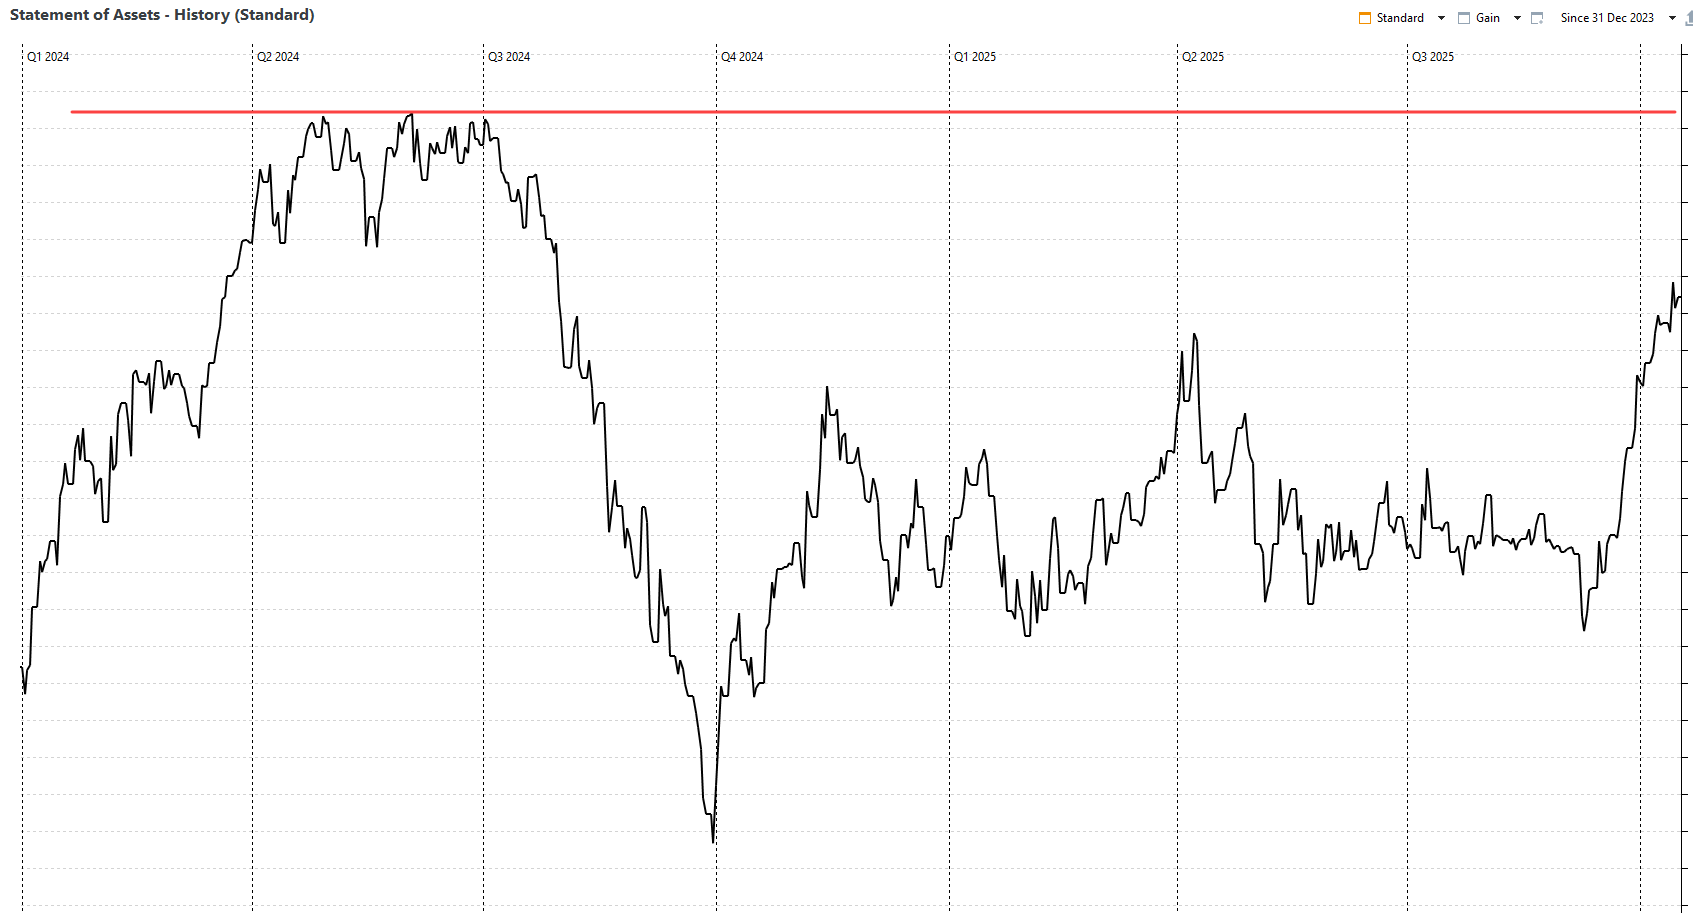
Here is my current Statement of Assets chart (Equity)
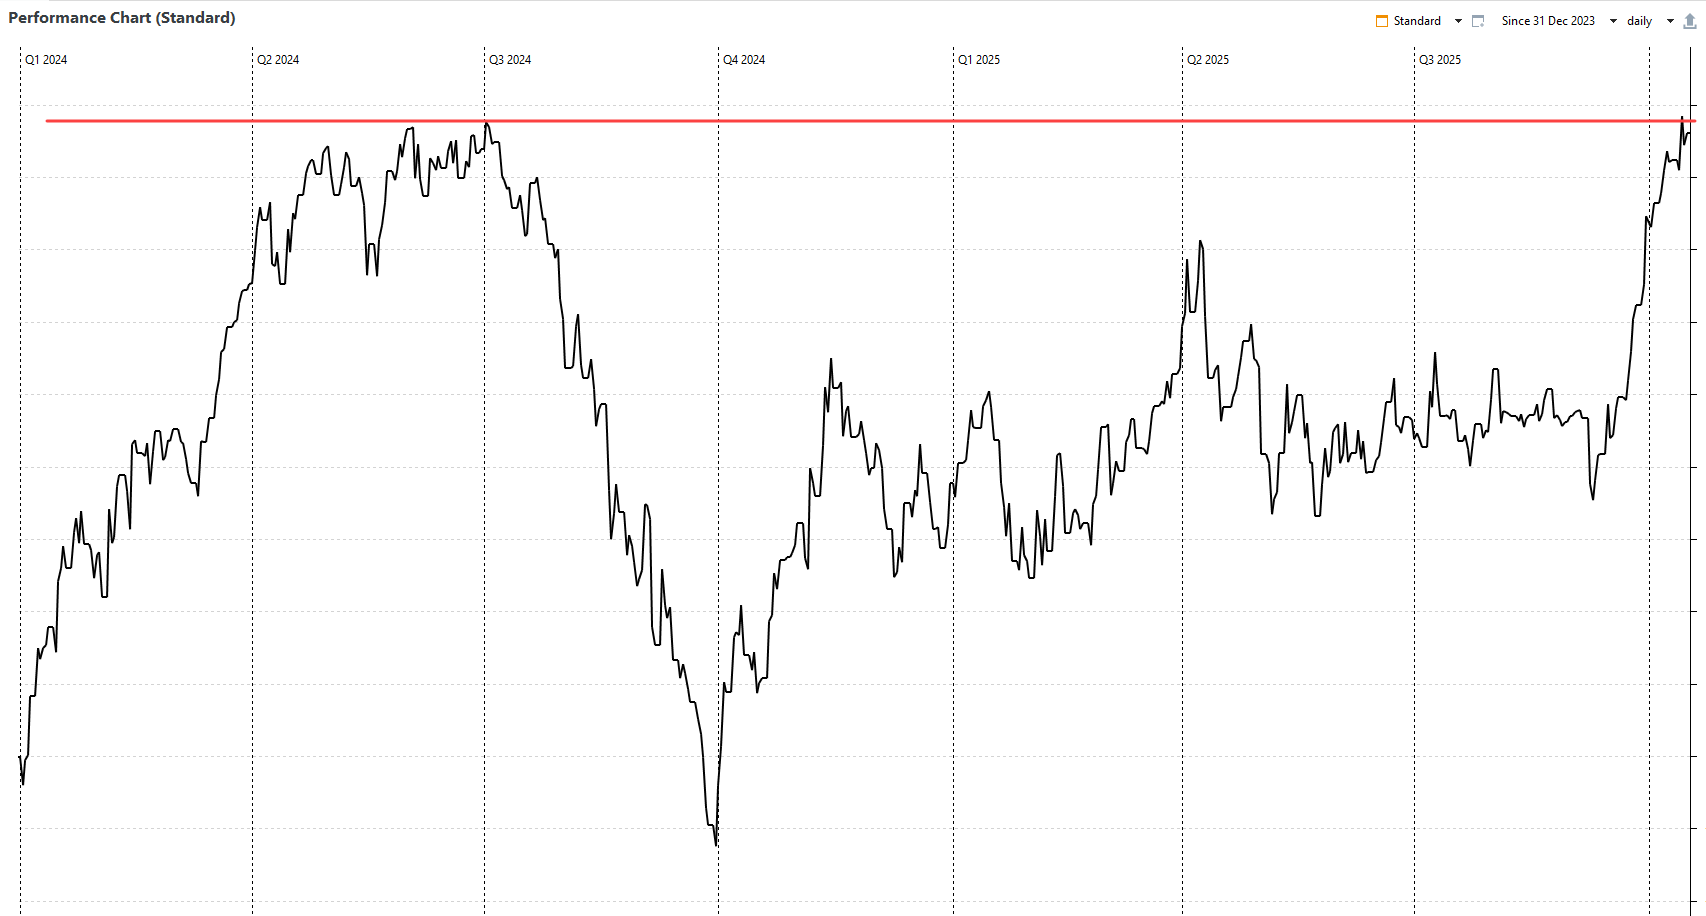
Here is my current Performance Chart
Here is what PP is current reporting as Drawdown
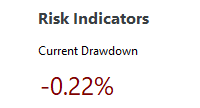
You can see that the Performance Chart matches quite well with reported Current Drawdown of -0.22%. However, you can see that the the Statement of Assets (Equity) chart shows the Current Drawdown is much greater (I have calculated an estimate of about -2%).
Based on this, it seems that Drawdown is calcluated from the Performance Chart when Drawdown is generally considered to be calculated from the Equity peak value to current Equity value ( and similarly Max Drawdown from max Equity peak to lowest Equity trough).
This is a multiple currency portfolio with USD, EUR, AUD, SGD cash and assets, so that would explain the difference in shape between the two curves due to historical FX calculations.
Many Thanks