Hello,
Thank you so much for this software! It is going to help so much in keeping track of and gaining insights into my investments.
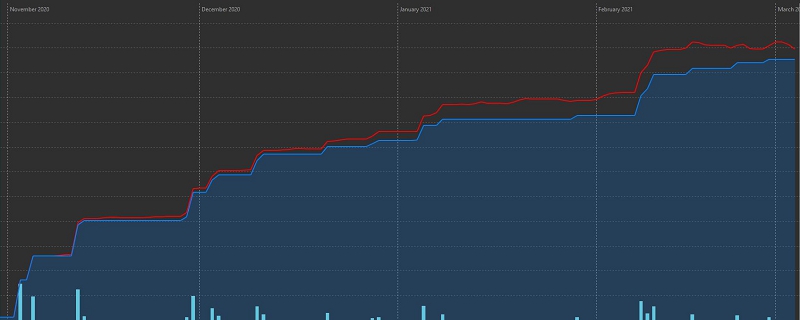
There is one thing that I have been looking for; is there a way to create one chart that shows both the purchase value of your investments in one graph and the market value of your investments in another graph? Both in the same chart, so that I can track over time how much my investments have increased or decreased in worth compared to the money that I invested?
It seems to me that all the data needed for this should be available in the application.
I hope that my question is clear.