Help with Degiro: Plots and how to split stocks from ETFs?

Hi all

I have created 2 securities accounts because I want to split stocks and ETFs. I have imported all my data from Degiro.

I want to “move” the Vanguard transactions in the second securities account names “ETFs”:

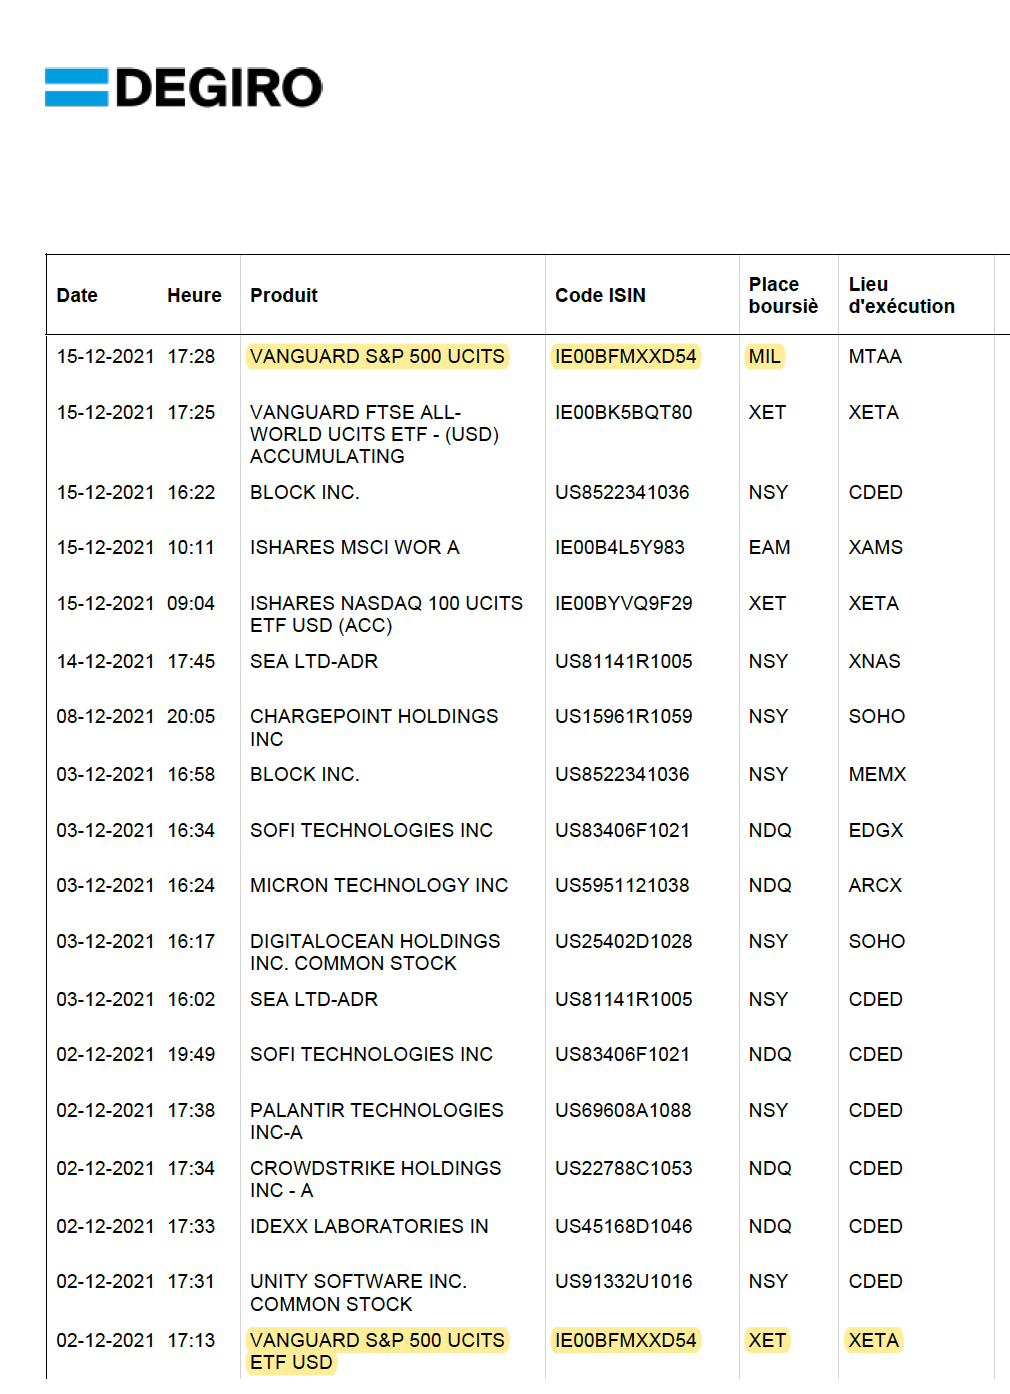
If I select the transaction and I go to “security transfer”, it is moved but the date of today is used as starting day for the asset. I want to preserve all the initial info. I just want to “move” it to “ETFs” and remove it from “Stocks”.

Any help?

Hey makis,

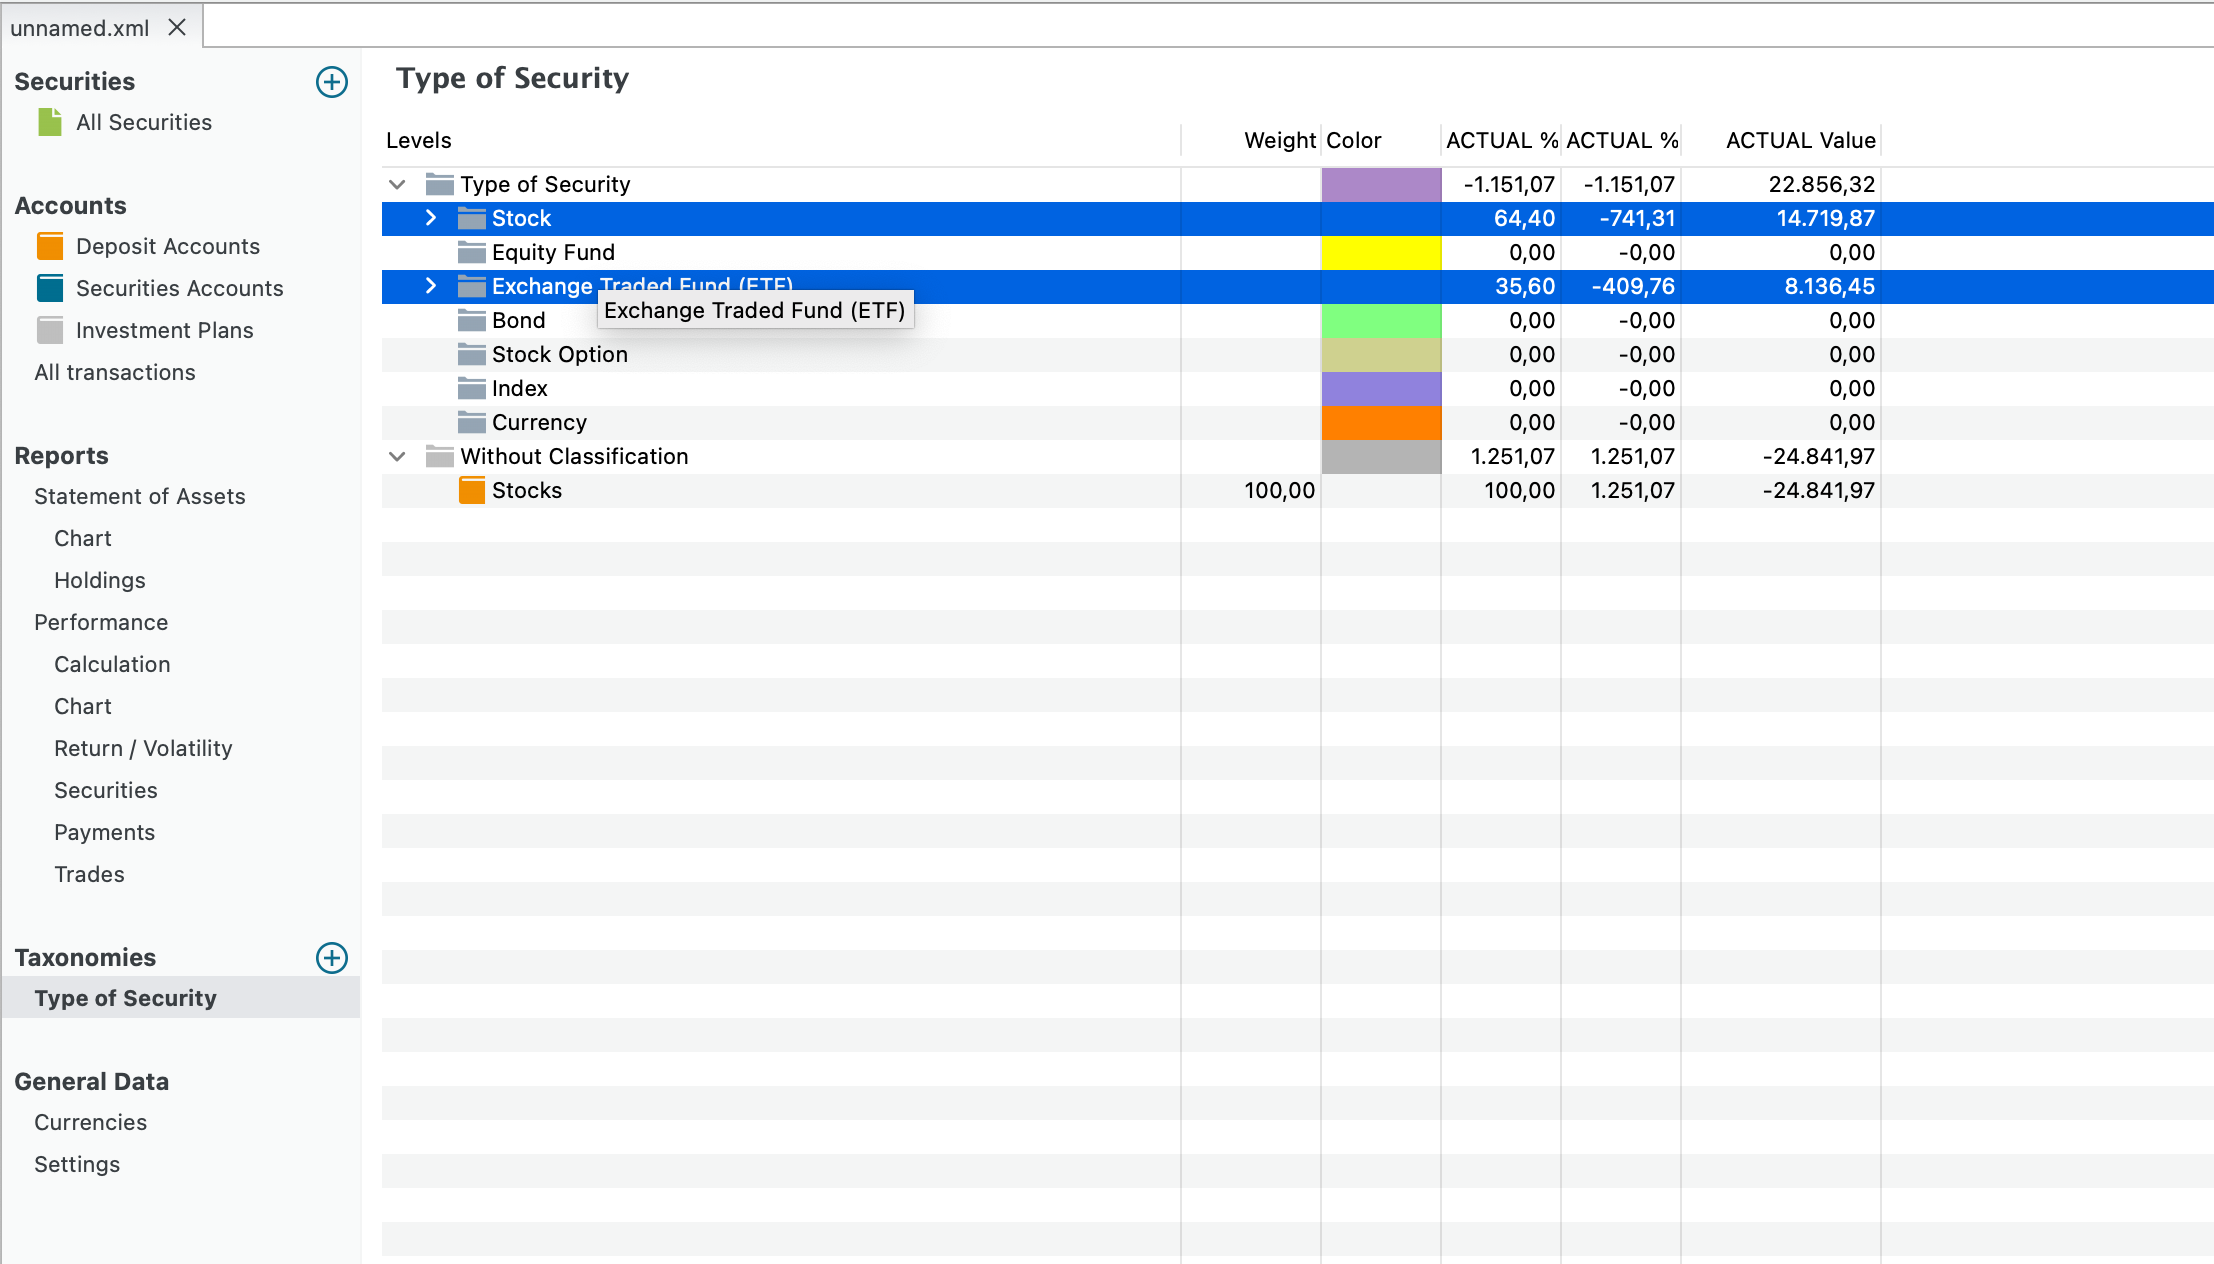
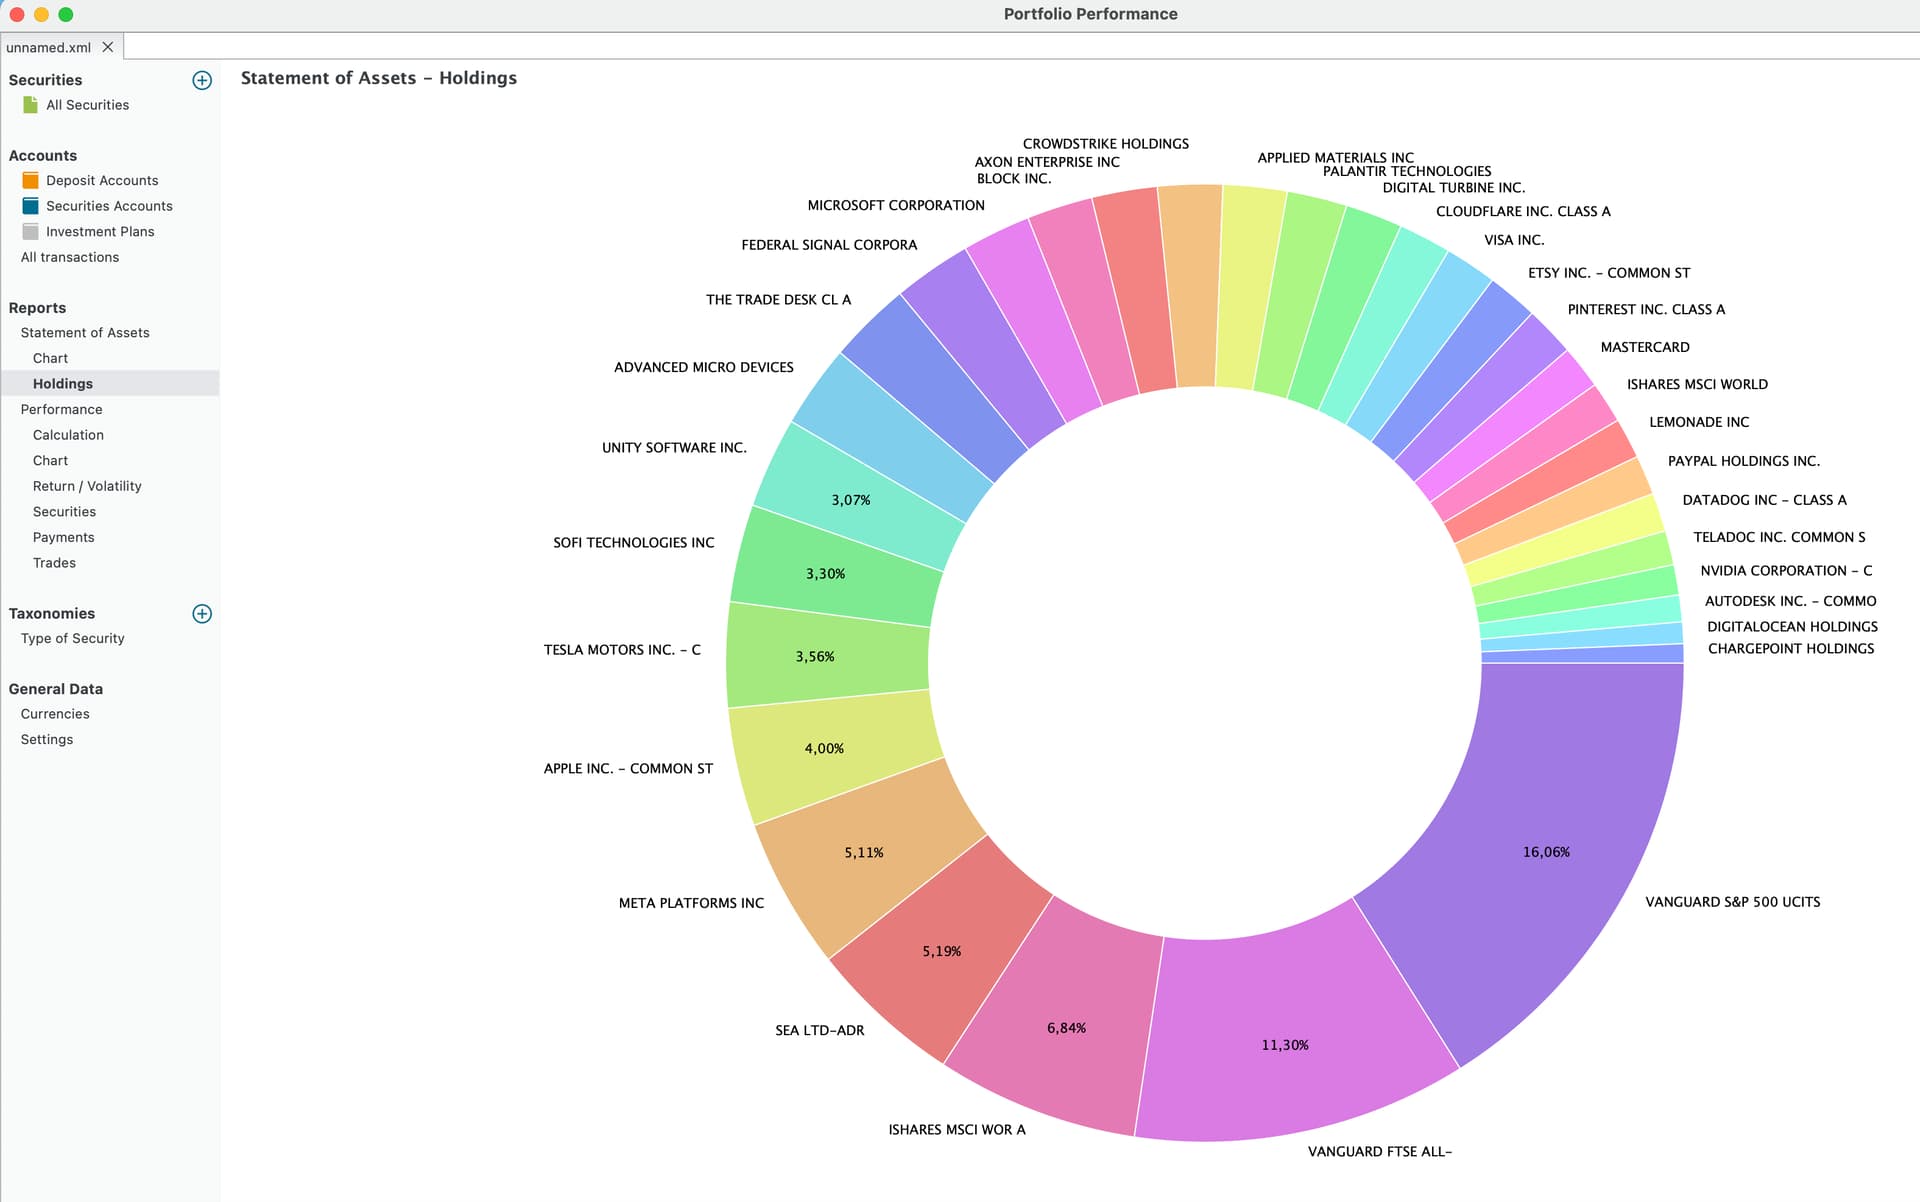
rather than transferring securities to virtual accounts why not making use of Taxomonies? You create a taxomony, e.g. named “Type of security”, underneath that you create levels such as “ETF” and “Stocks”. You then announce these levels to the securities.

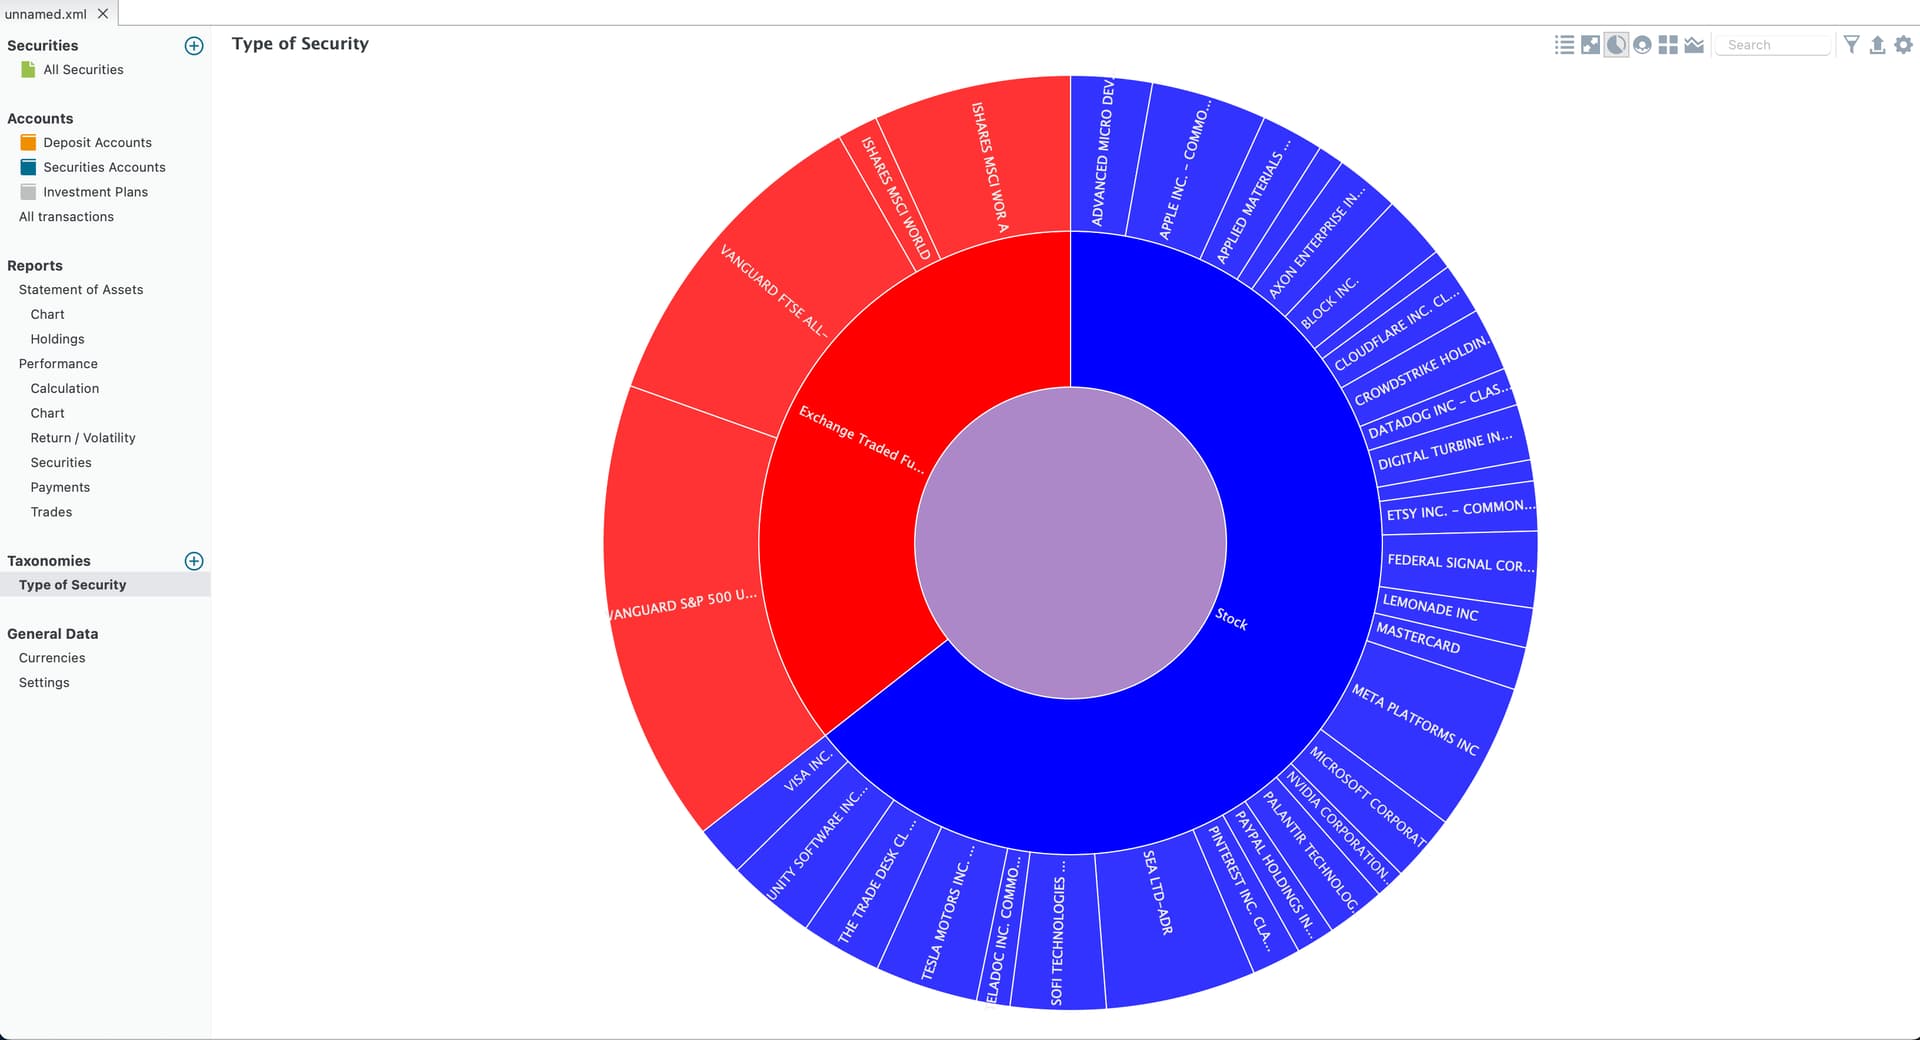
This way you have more flexibilities in bundling or comparing securities for diagrams or reports.

Thank you. I have tried this and I need some additional help.

I will break down with figures my current situation.

I have imported my Degiro Transactions from the PDF file and everything was imported without errors.

My Deposit looks like this:

And my Security like this:

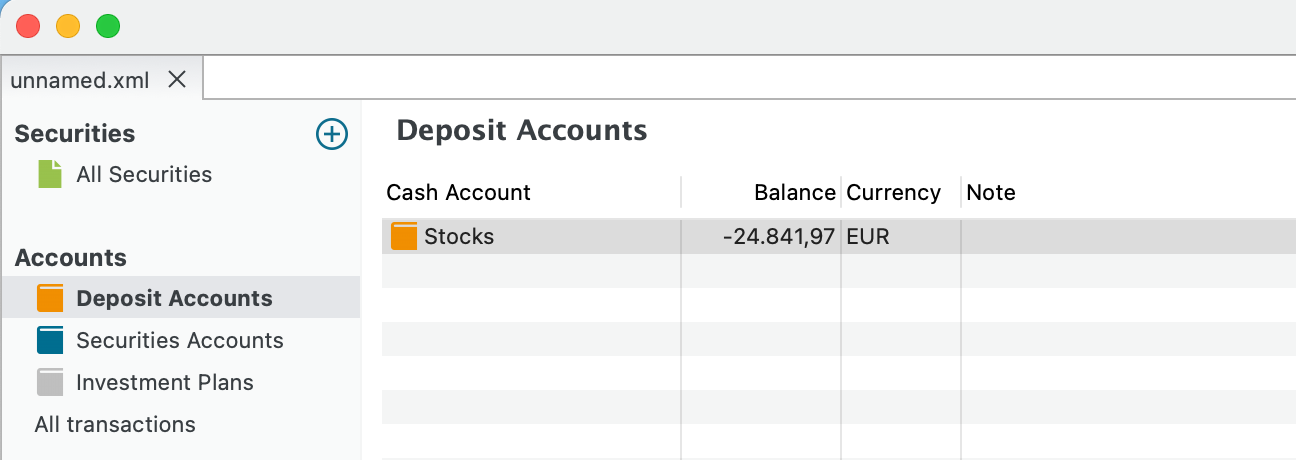
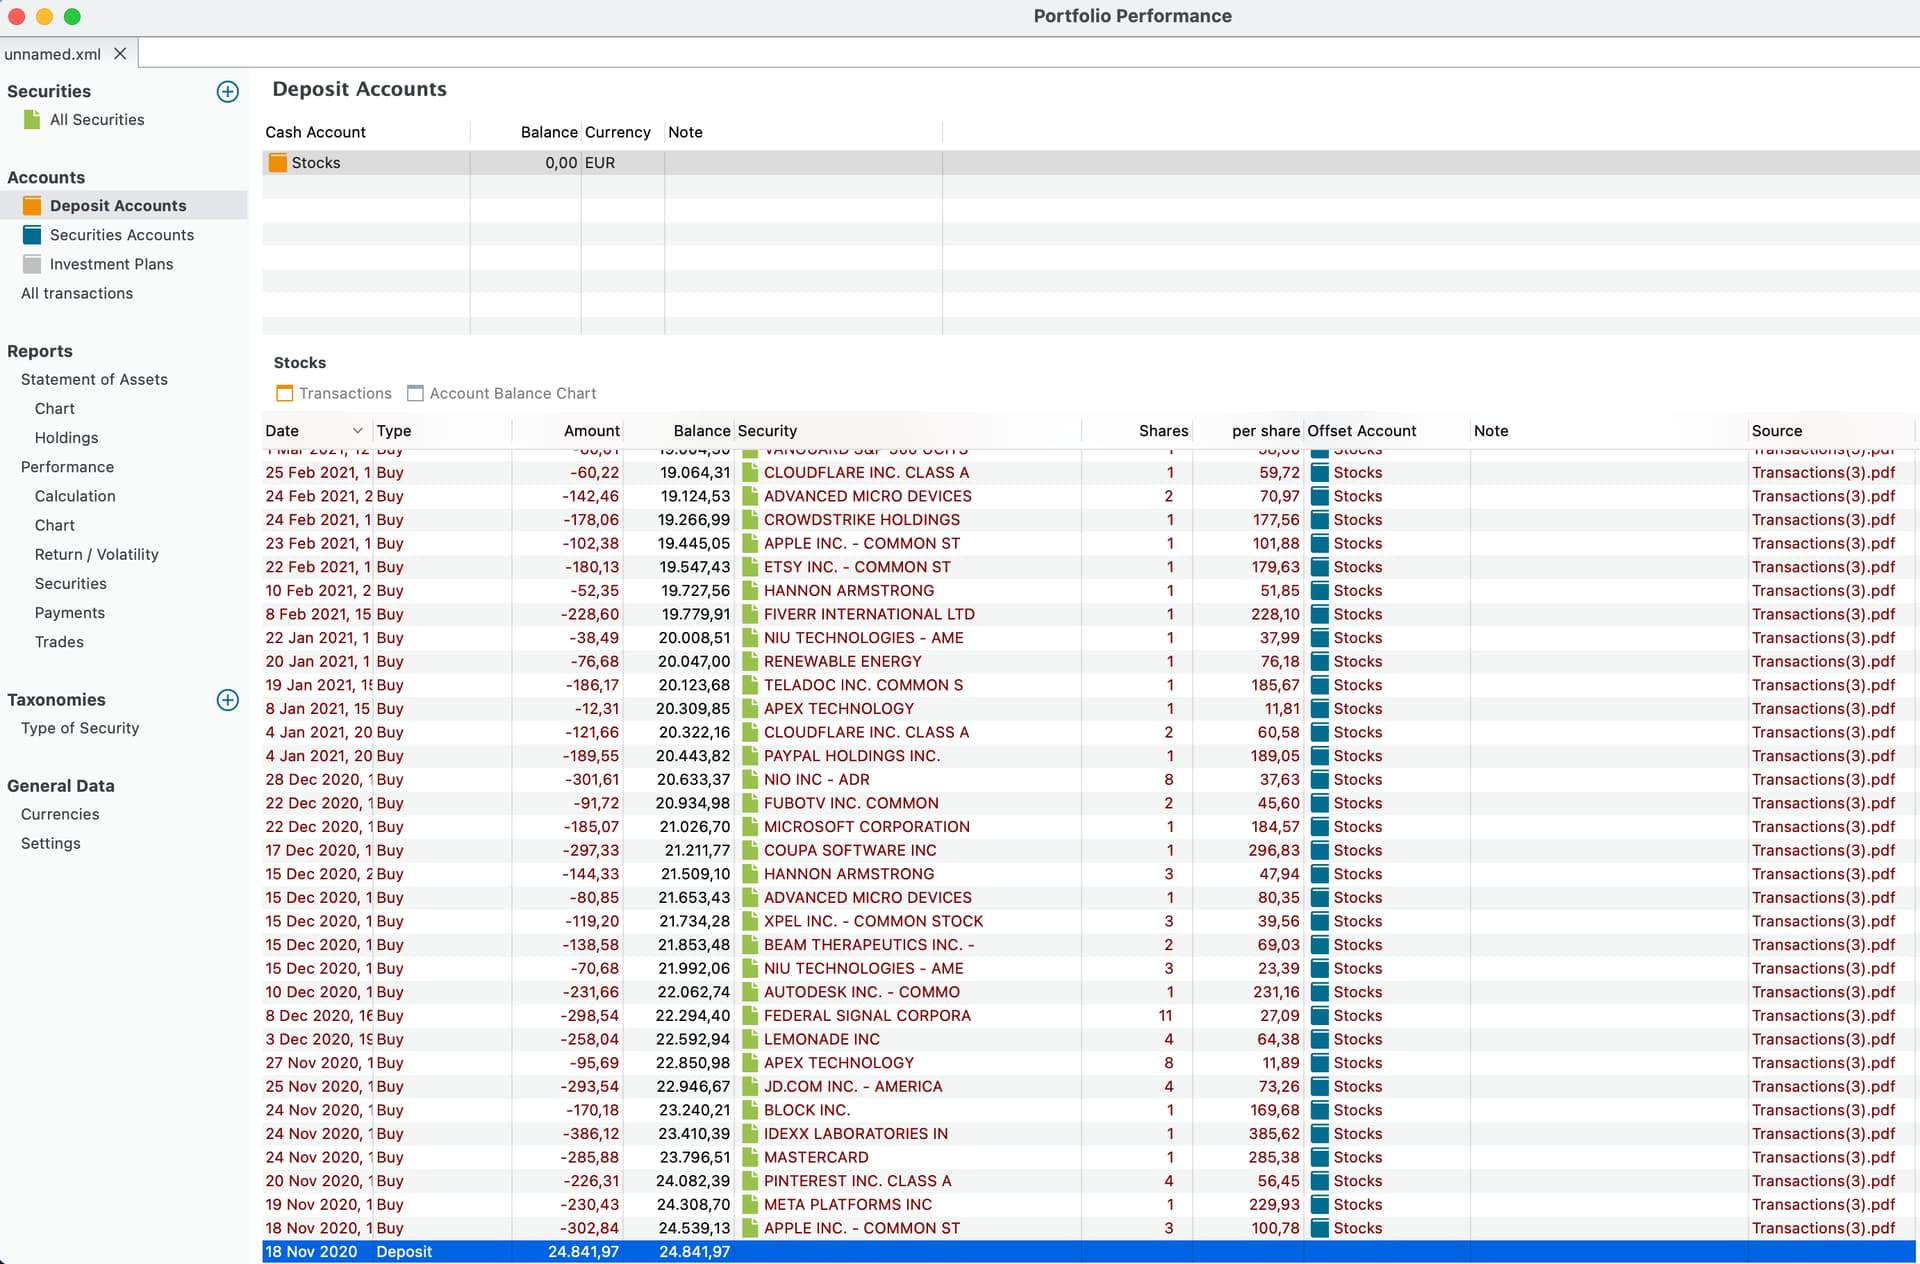
Question1: Degiro reports a 2k current unrealized loss so the numbers seem ok even though it is weird that the software puts a minus sign in the Deposit Account. How can I flip the sign?

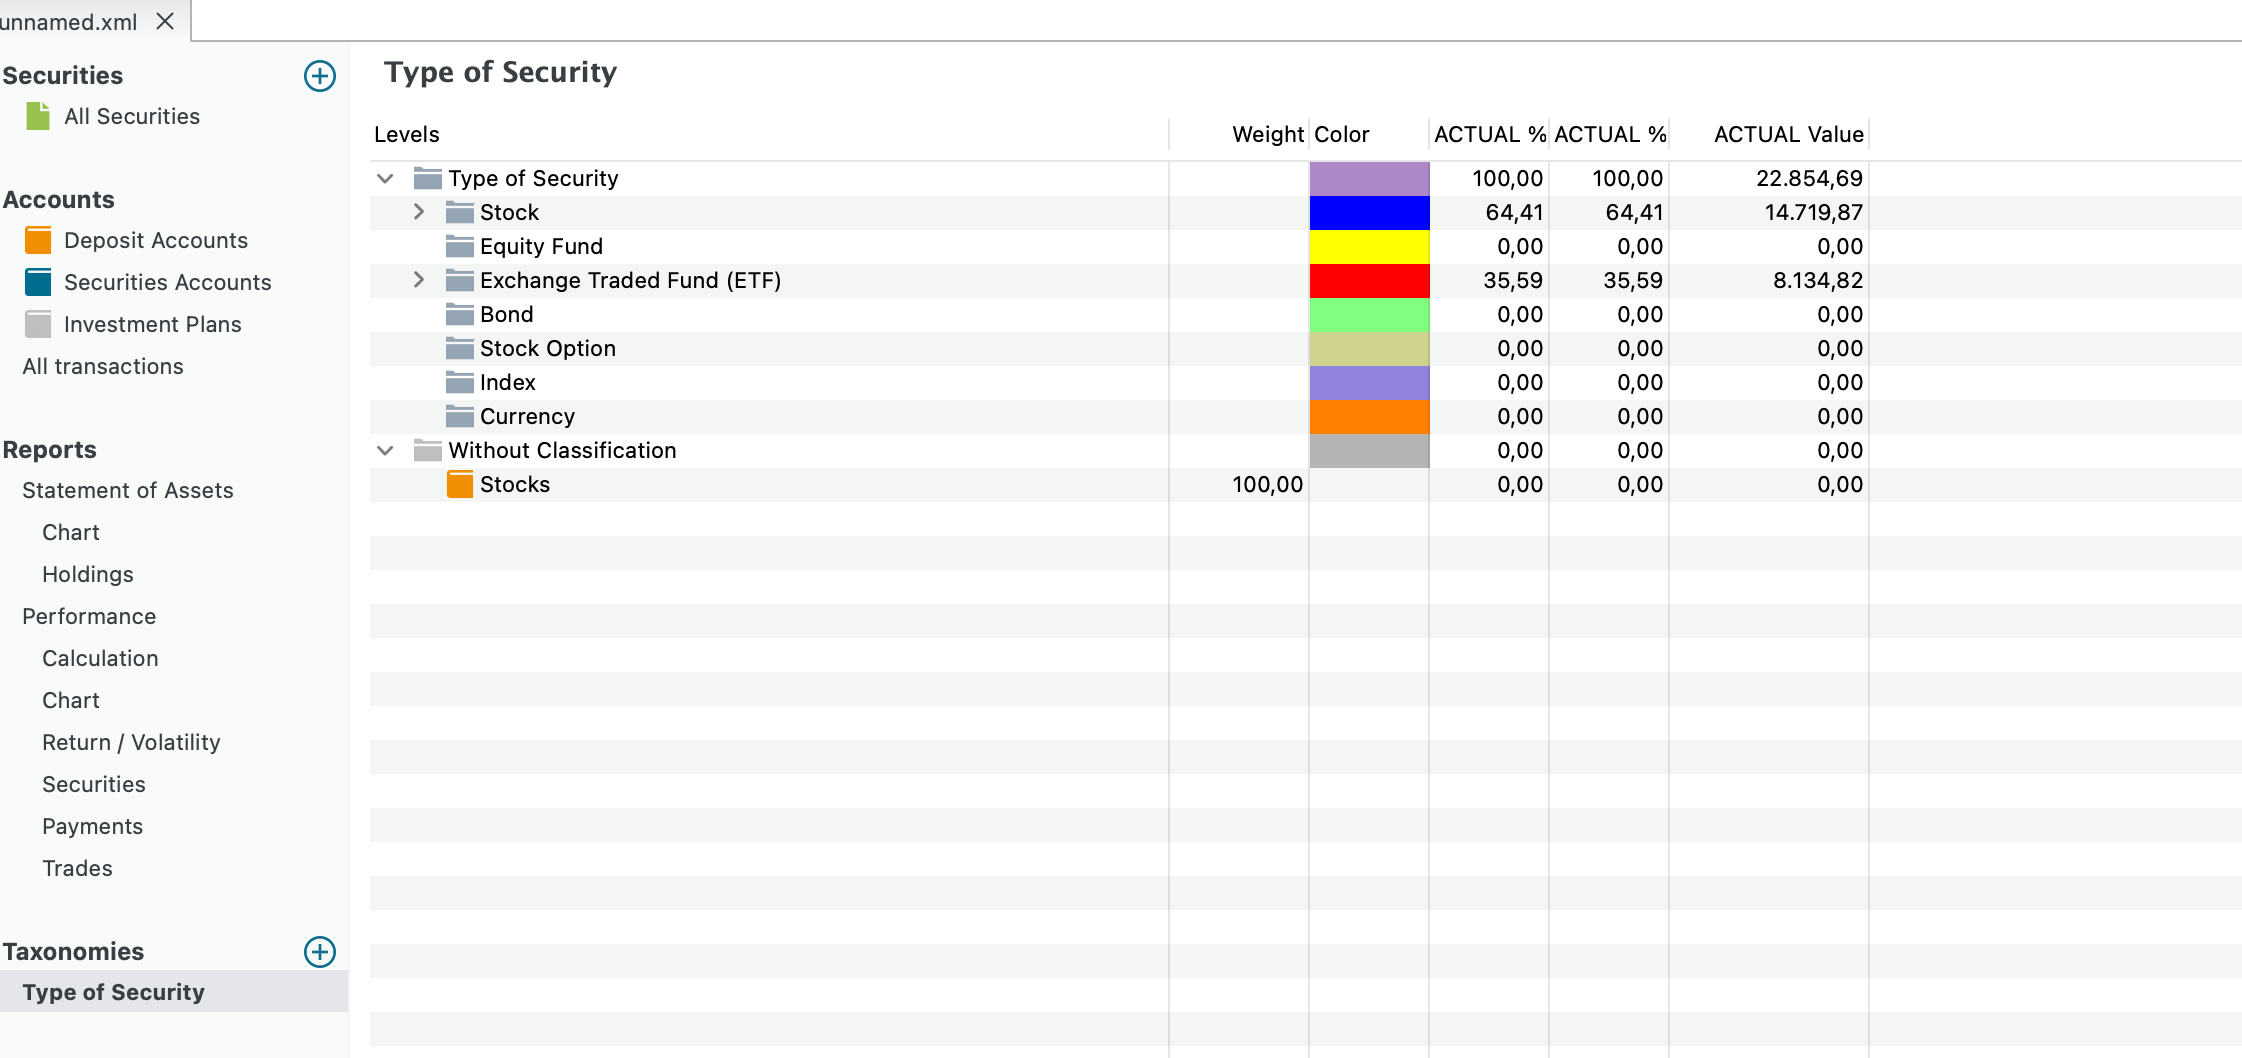
Next, I did what you suggested and I have this now:

Question 2: Now I want to get the below figure but for my stocks and ETFs separately. Is that possible? @Harry_Hirsch

Well, the minus sign means that you have a negative amount in your account, a loan. If that doesn’t align with reality, then the transactions are wrong or incomplete.

This diagram can only be filtered by accounts. You could look at the pie chart of the taxonomy and zoom into the relevant class.

Thanks for the reply.

It is neither a mistake nor a loan. When you buy assets in Degiro, the paid amount has a negative sign in the PDF that is imported to the software.

Here is a screenshot of a part of the PDF:

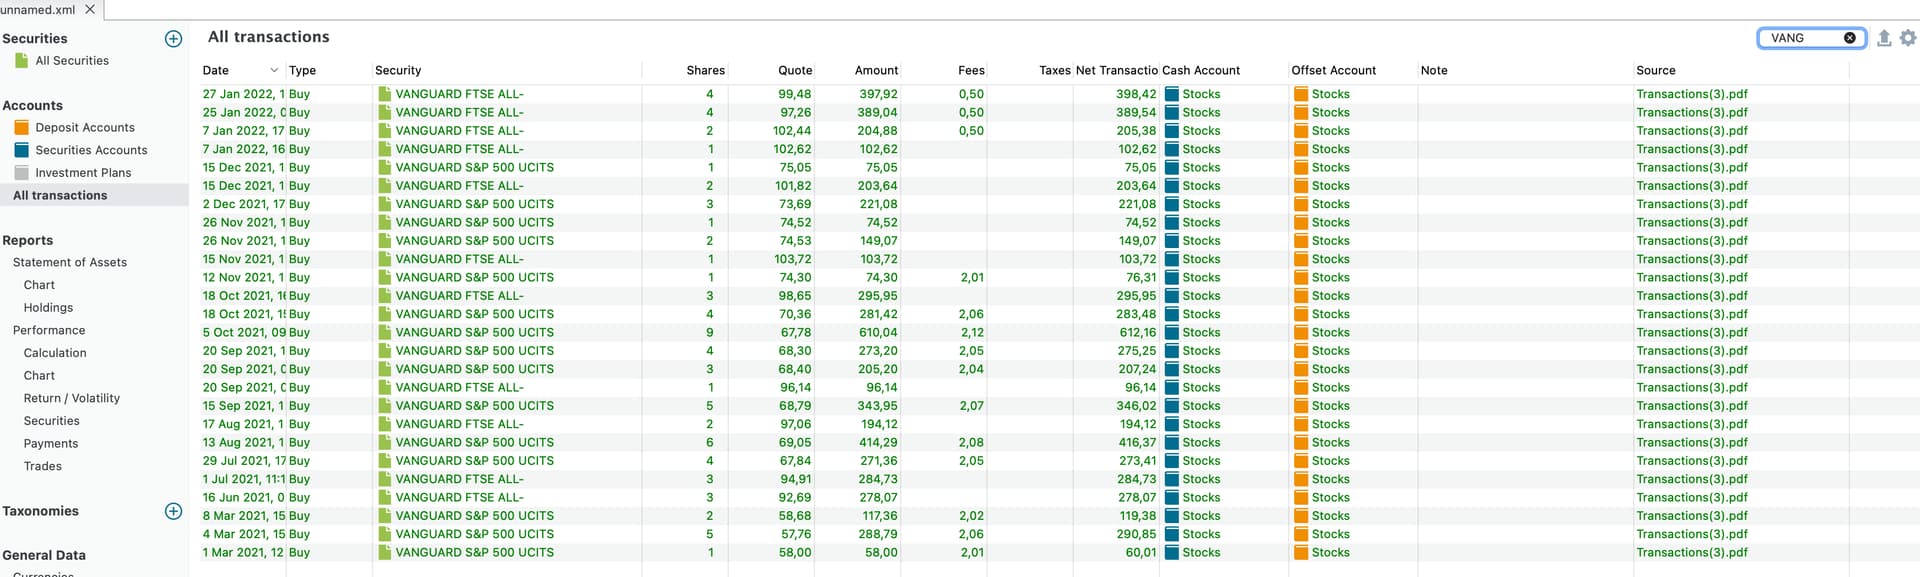
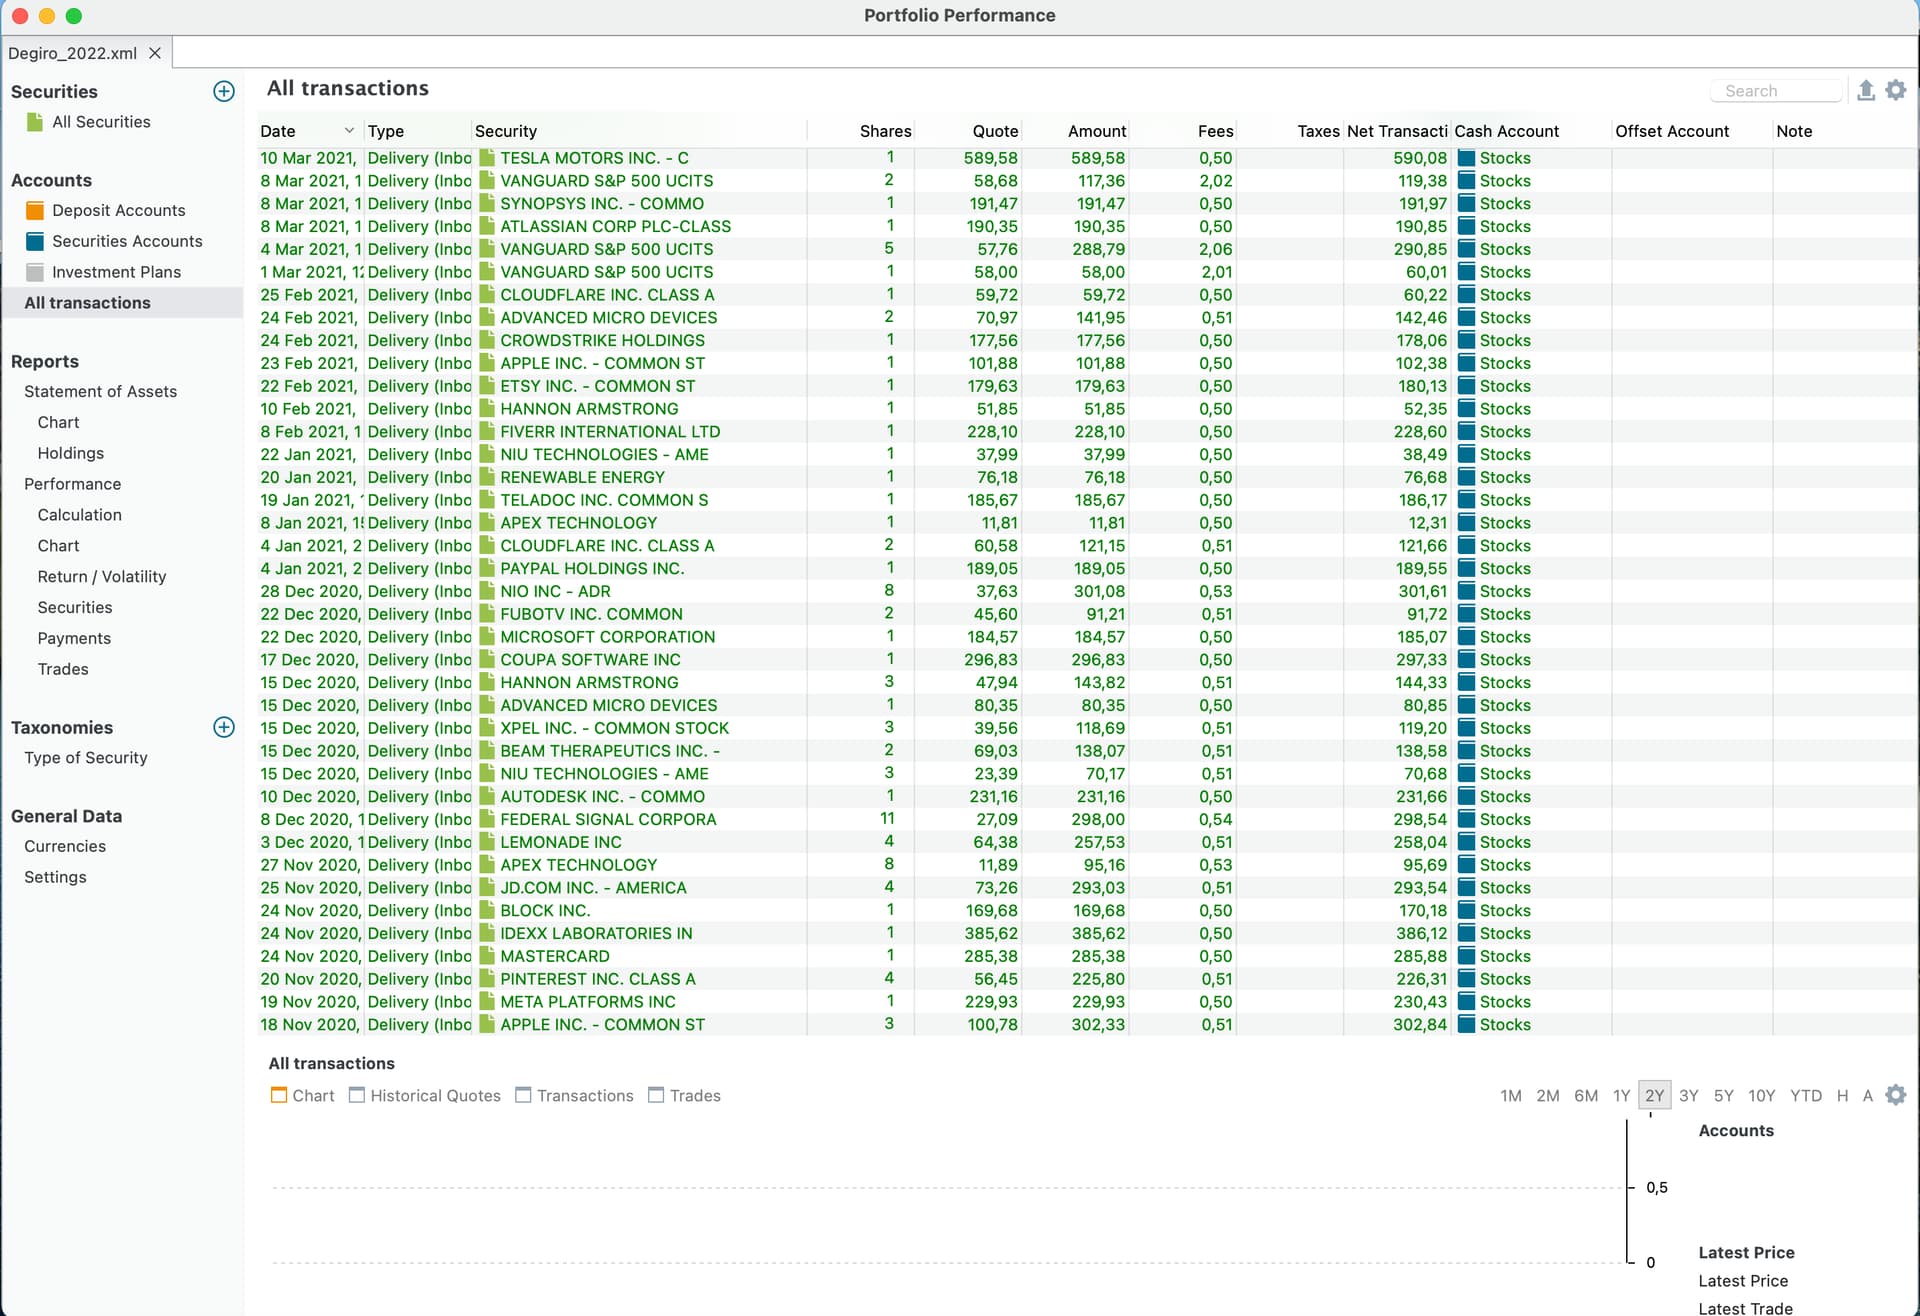
You can see that the final column has a negative amount indicating that this was a buy order.
A sell order has a positive sign since you get credited money.

That’s normal, yes. But when the total amount is negative, then more was spent than came in.

Should I add manually a deposit of 24.841,97 to make that Deposit Account = 0 since I have never used a loan or borrowed money?

Because I have indeed invested 24.841,97 in total and my current portfolio value is indeed 22.856,32.

This is also shown in PortfolioPerformance richtig Einrichten TUTORIAL 📊👨🏻‍💻 | Sparkojote - YouTube at 5:41. I do not speak German but it is obvious.

If I indeed add a manual deposit (at day 0) to just make 0 the Deposit account then everything seems perfect:

Deposit at day 0:

Taxonomies ok now:

Beuatiful plot:

Hey makis,

if you want the deposit account to be zero, i.e. a buy or a sell of securities should not show up in the account balance you can use Delivery (Inbout)/(Outbound) rather than buy/sell. Deliveries do not run through your account.

This way you do not need to generate a deposit at the beginning (unclean way of working). I recall that at import level you can chose to convert buys/sells to deliveries. On the other hand there is nothing bad in having a negative account.

I hope this helps

This is a great idea. I might try this thanks.

One last question. For now, in order to choose Yahoo finance as source for the quotes, I have to right-click on each asset (one by one) and then choose YF as source.

Is there an easier way to do that?

Hey makis,

no there is not, as you can chose different sources for different securities or different stock exchanges for the same source, sorry

clear thanks for the help. appreciate it

Hopefully my last question :slight_smile:

I have added everything from the beginning and I selected Delivery while importing. Everything is perfect now.

My only problem is that there is a spike (in 18 Nov 2020) in the Performance → Chart that I cannot make sense of.

What exactly does this plot show?

18 nov 2020 was the day of my first investment in AAPL:

Is that normal?

Looking at Statement → Chart, I see a value of 431.57 for 18th Nov 2020 which does not make sense

Any tip?

Hey makis,

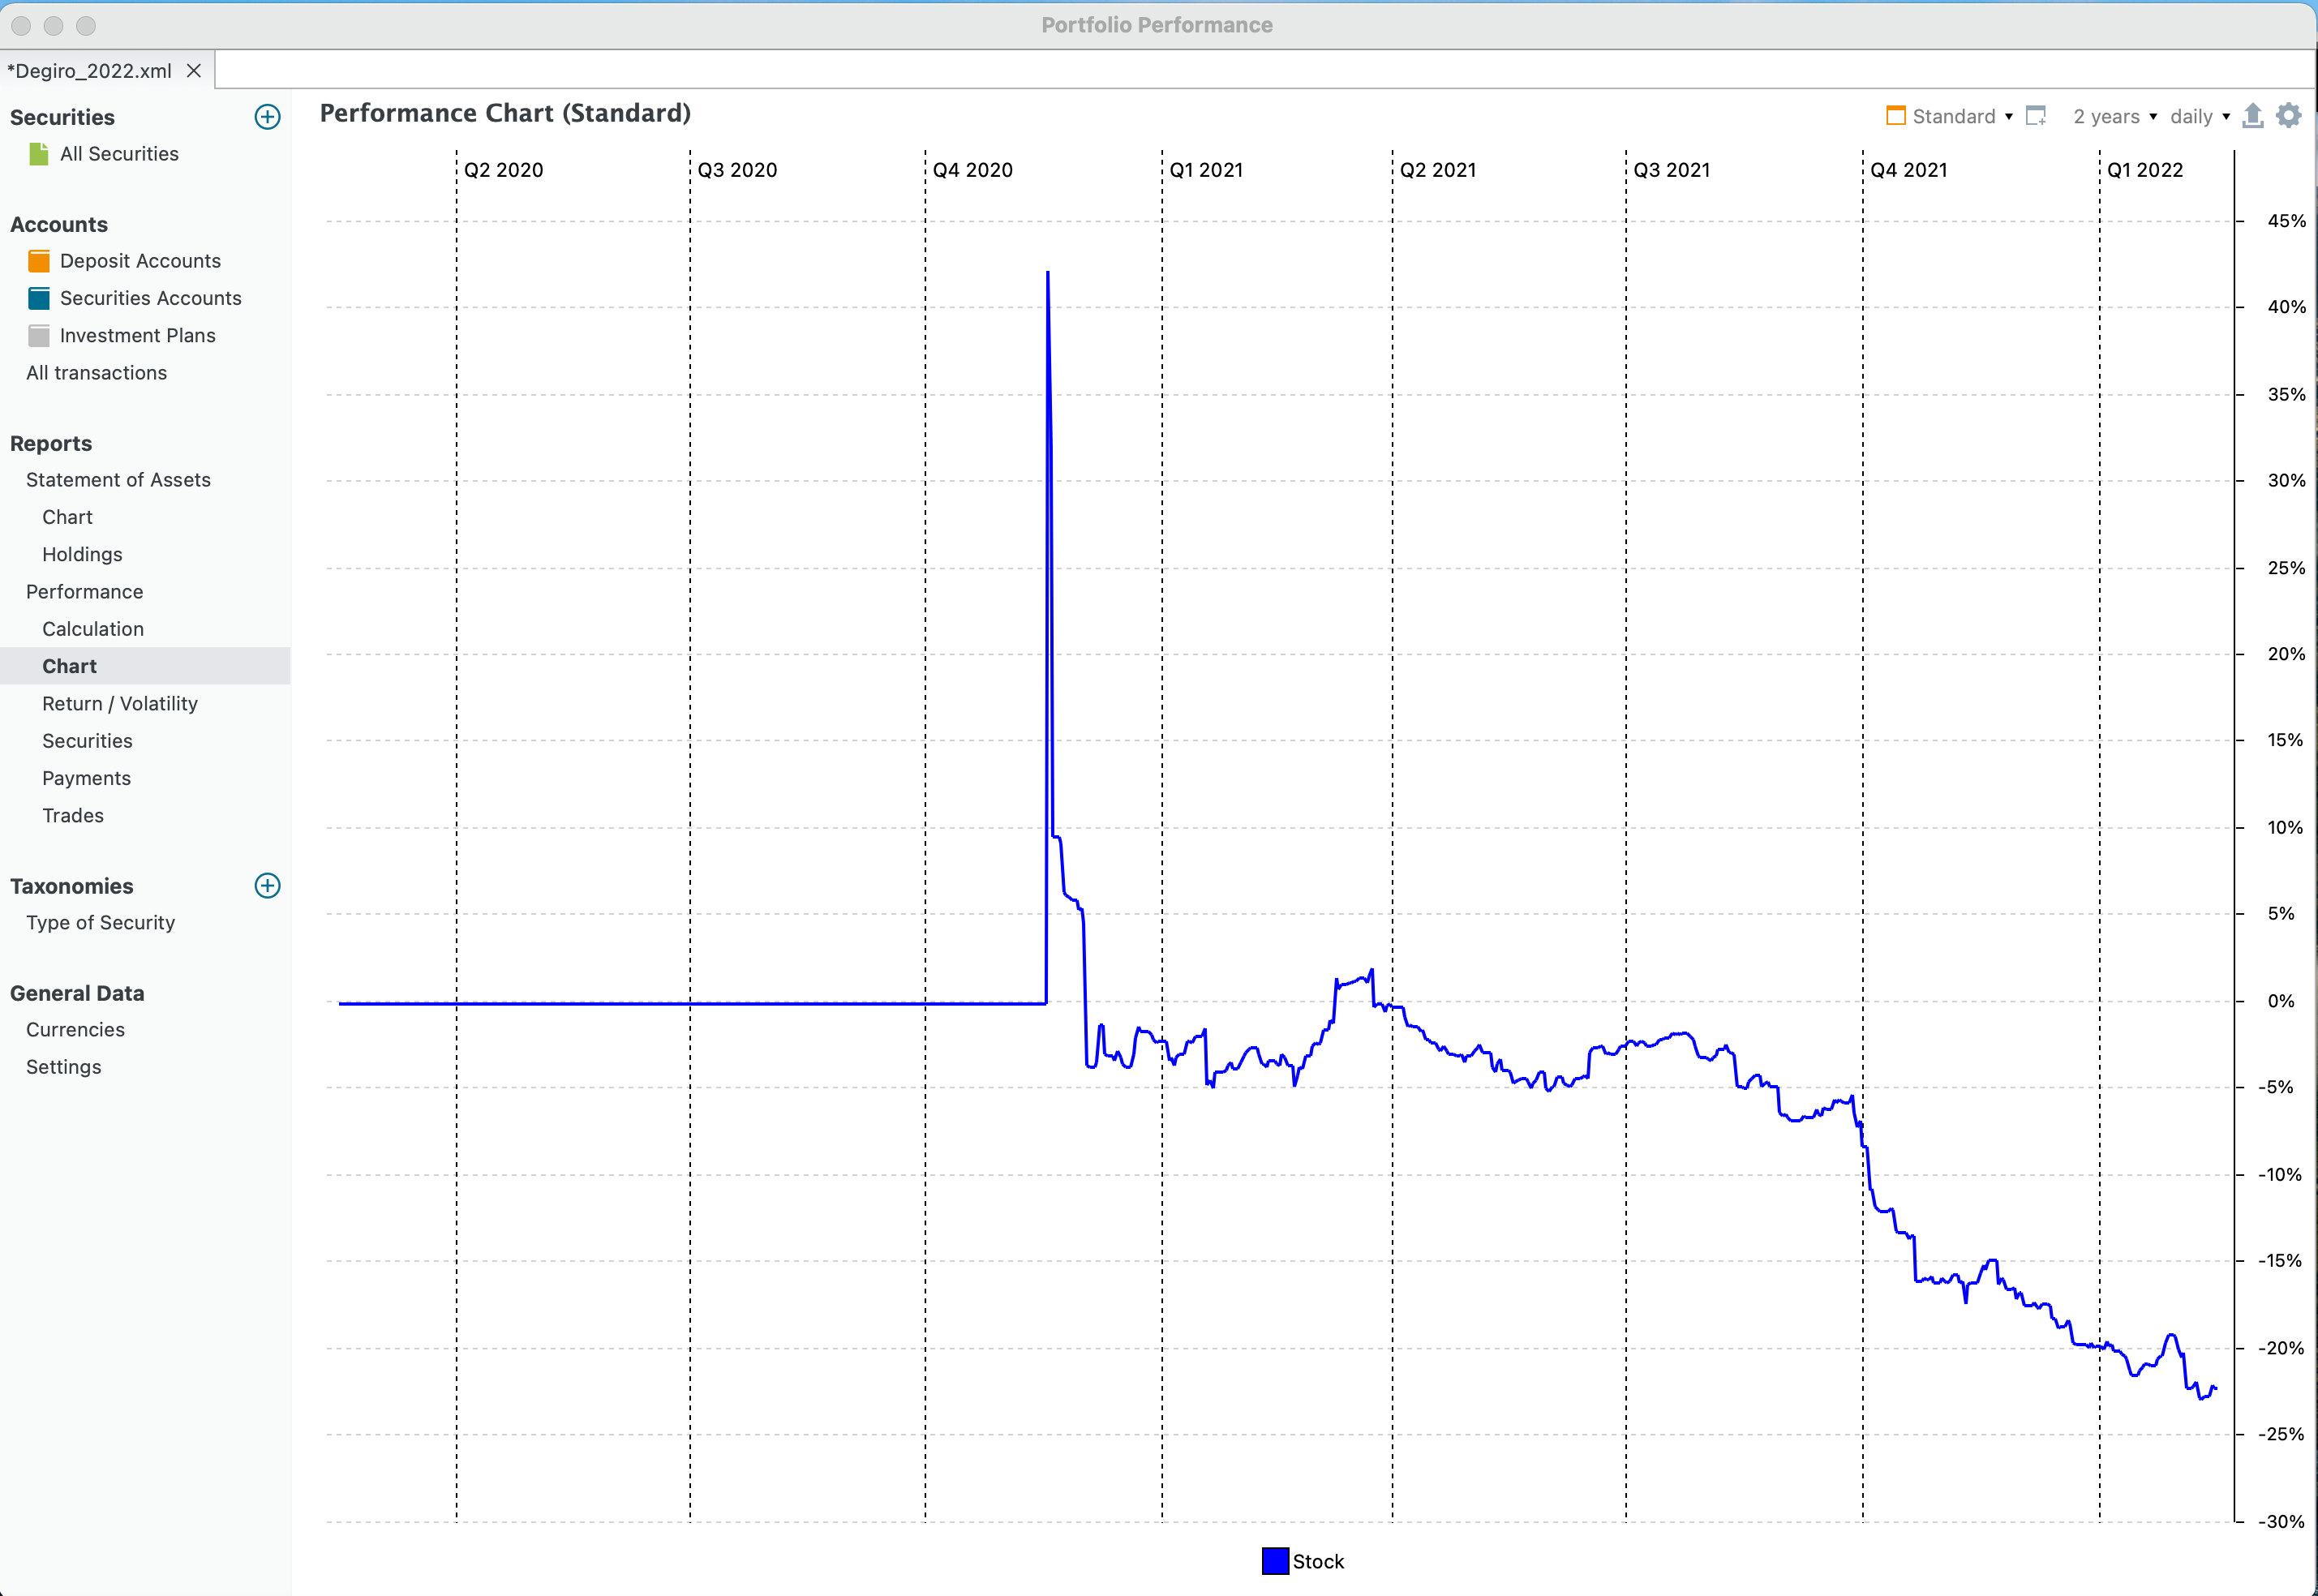
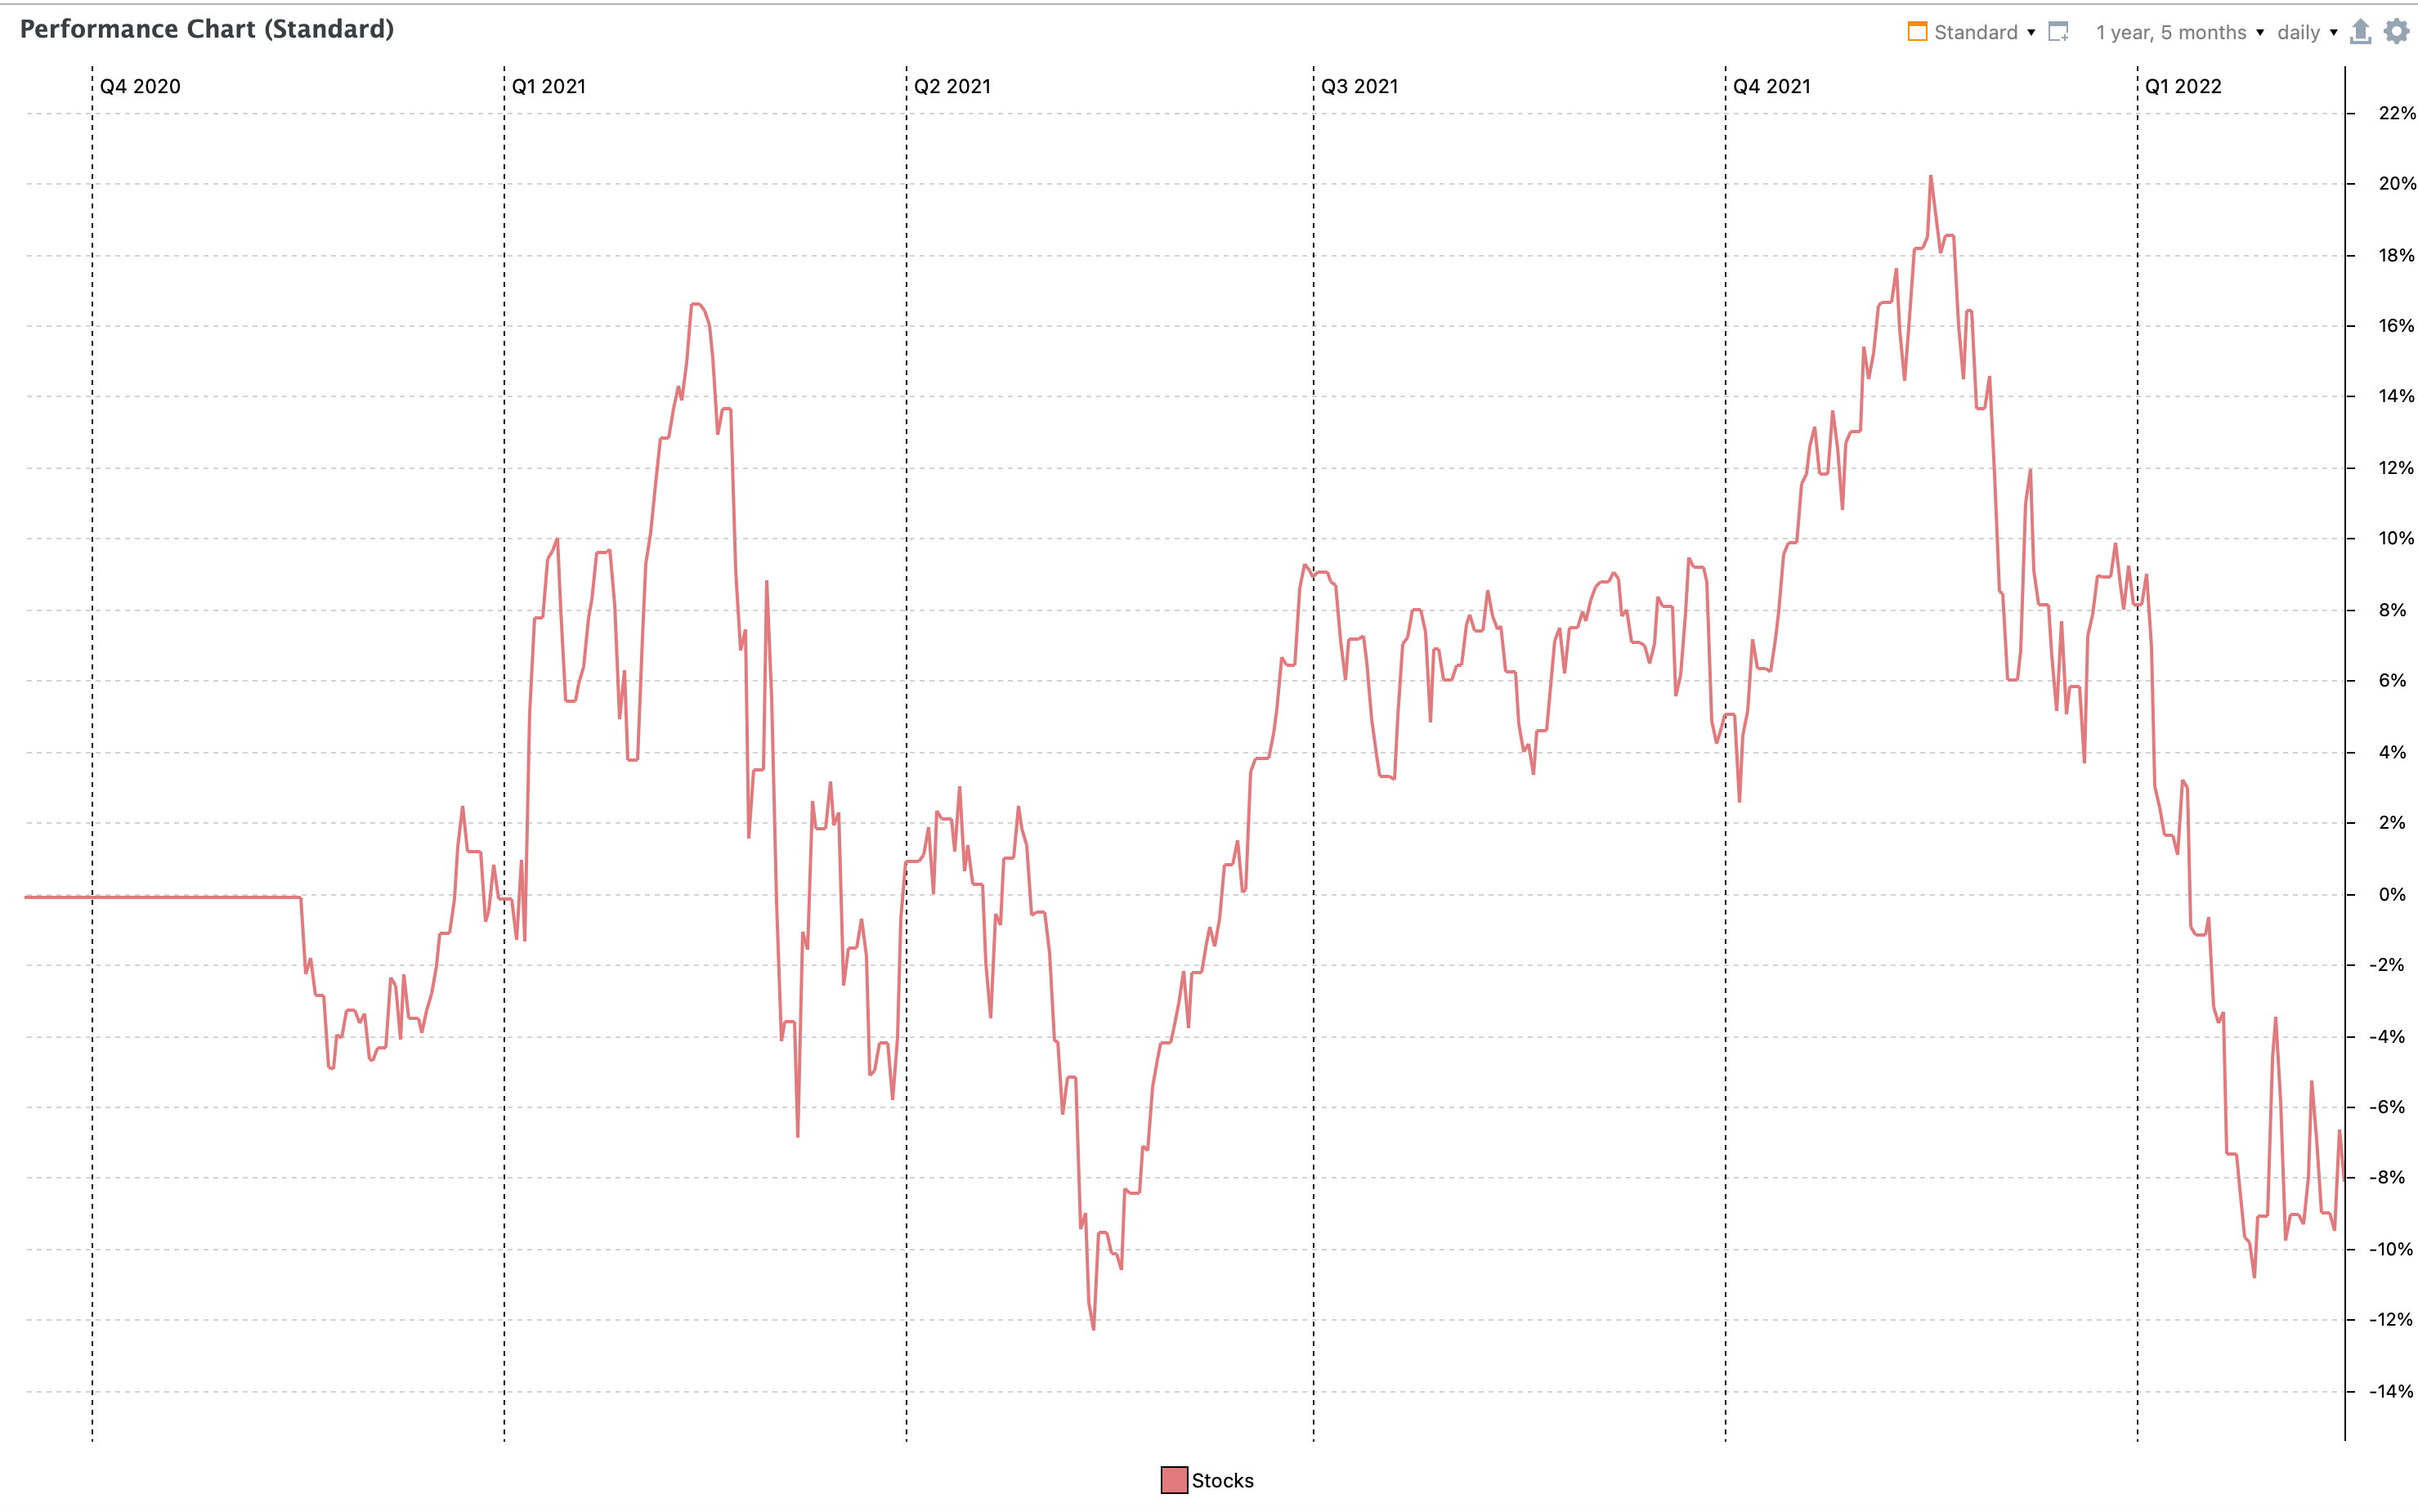
check the charts for the historical data of the early purchases (Apple, Meta, Pinterest). There may be a spike in one of those (wrong value from data source). This you can manually correct once located.

There is nothing wrong there. I also notice this:

18 nov 2020 I purchased apple shares, total worth: 302.84. This appears as “transferal”. No idea why “Stocks” value is 431.42.

I exported the data of the above chart and I have (first entries):

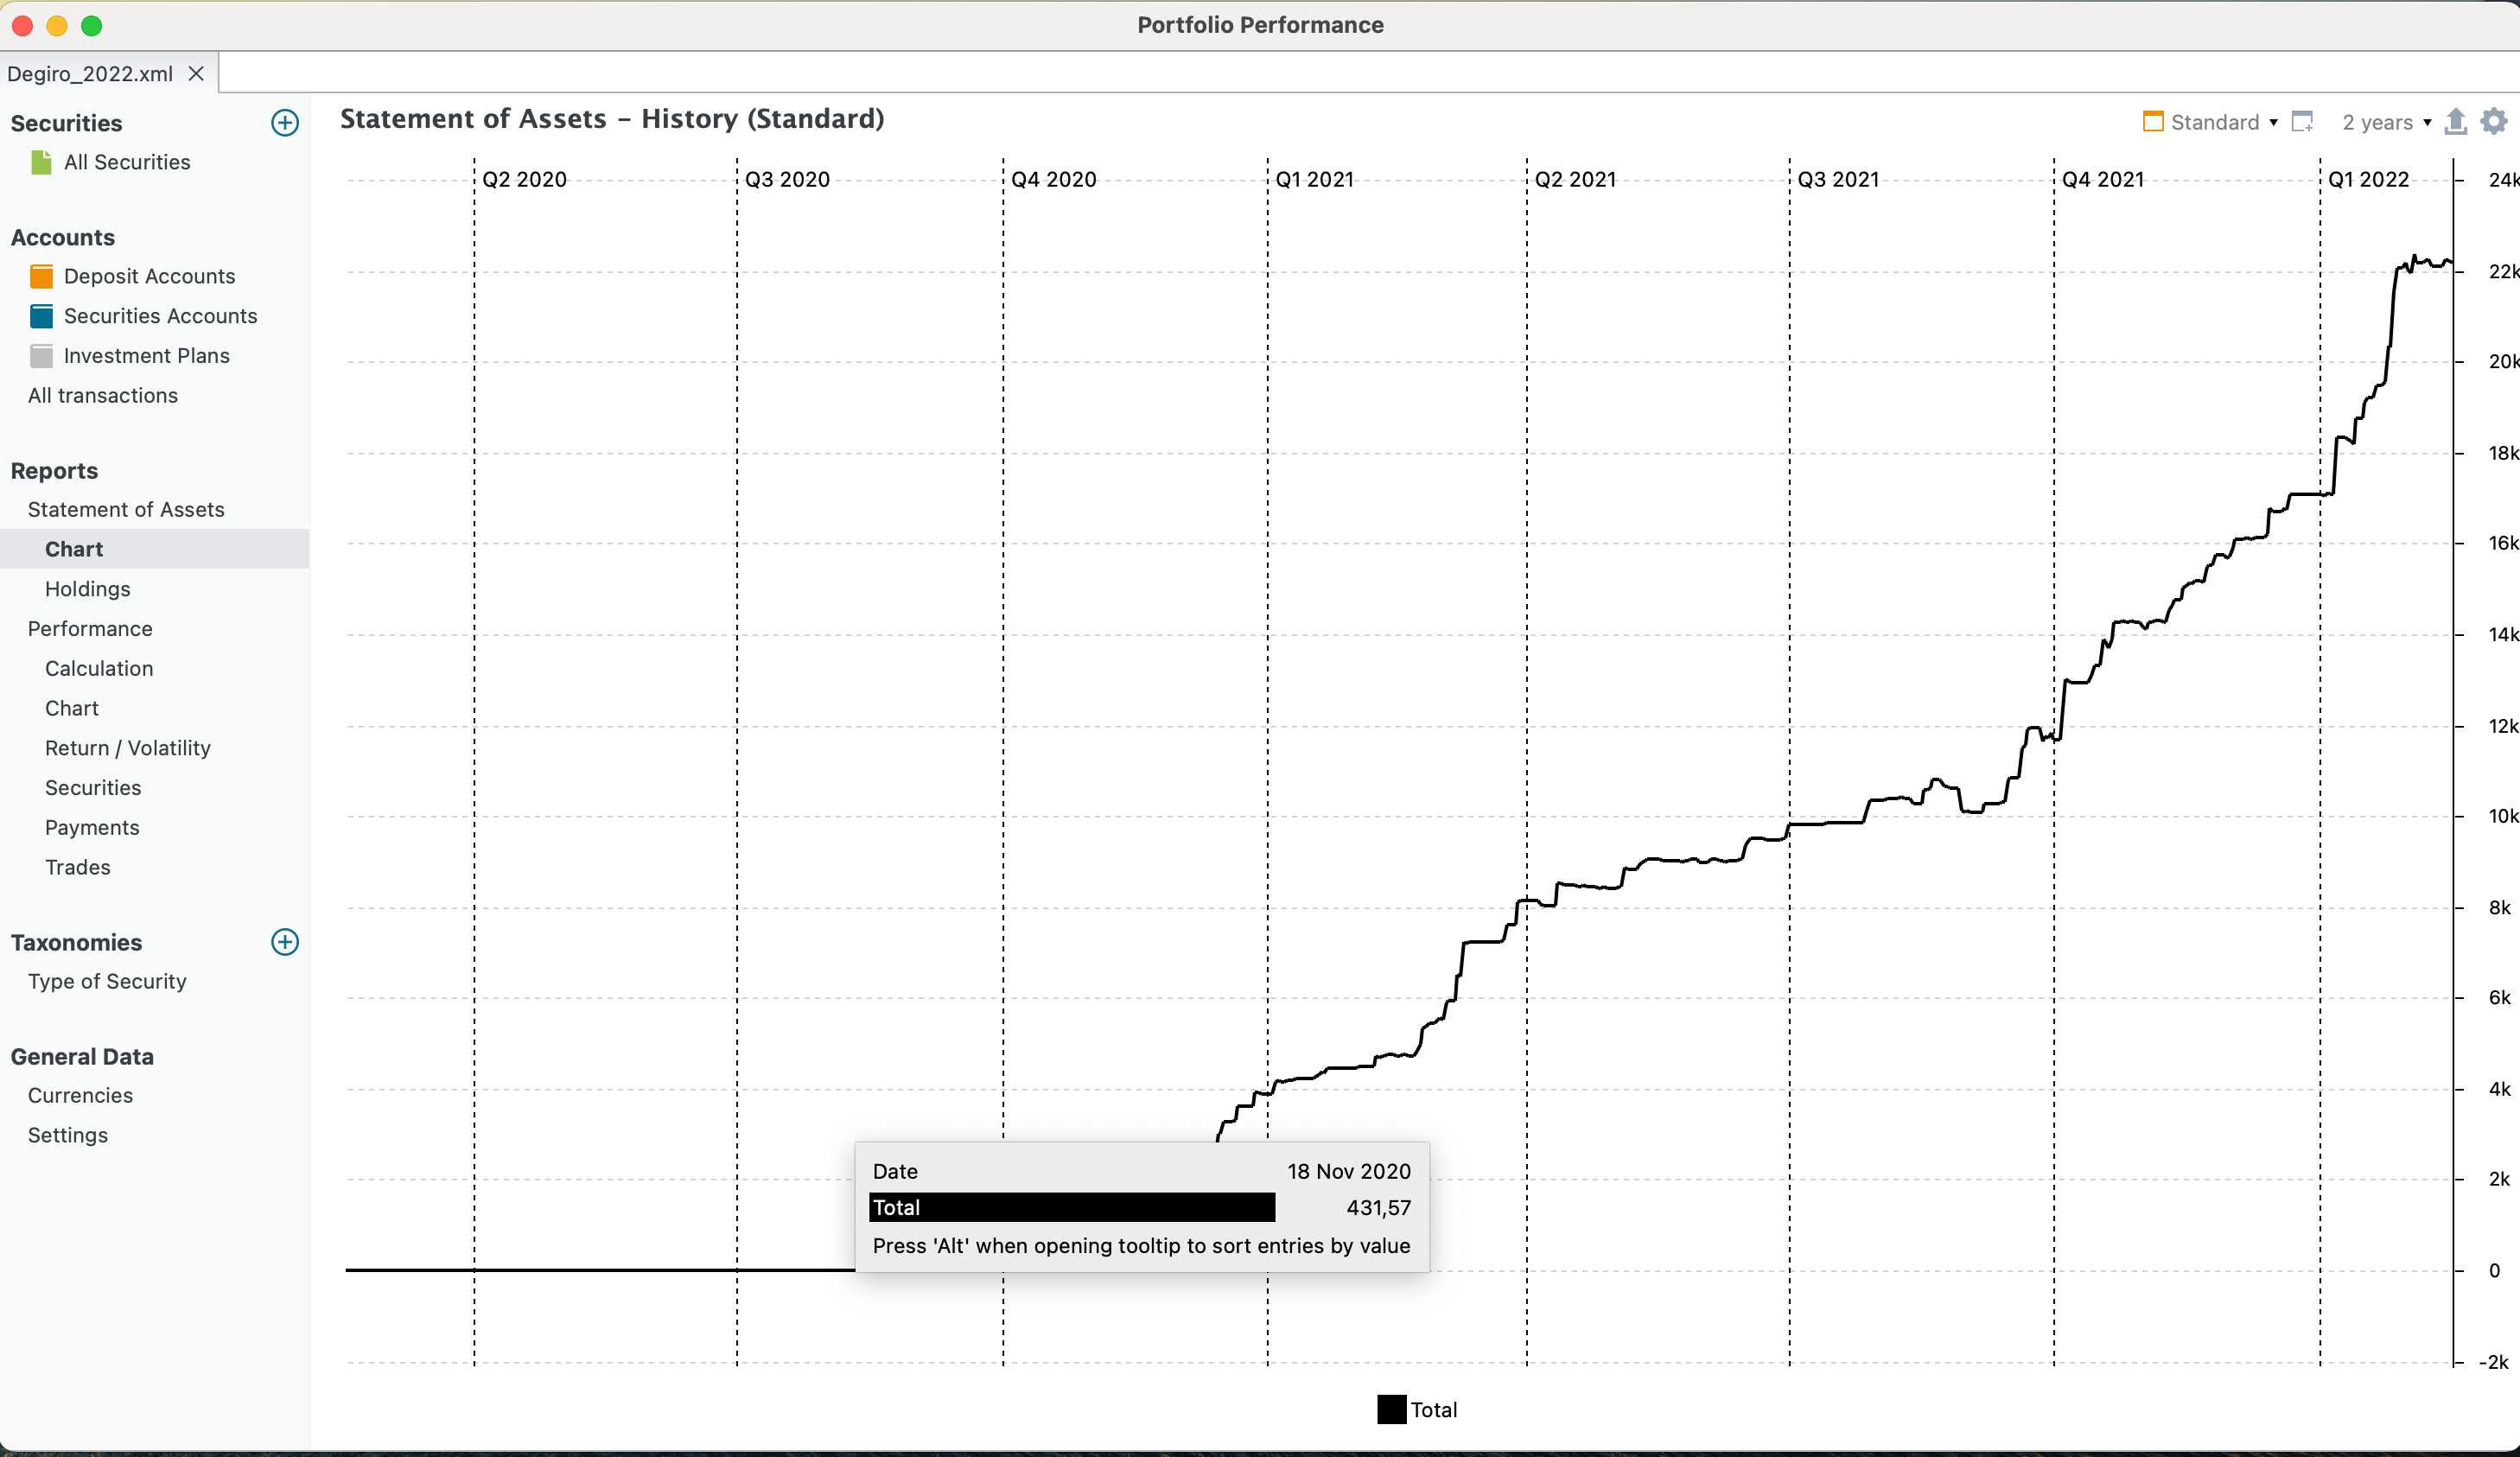
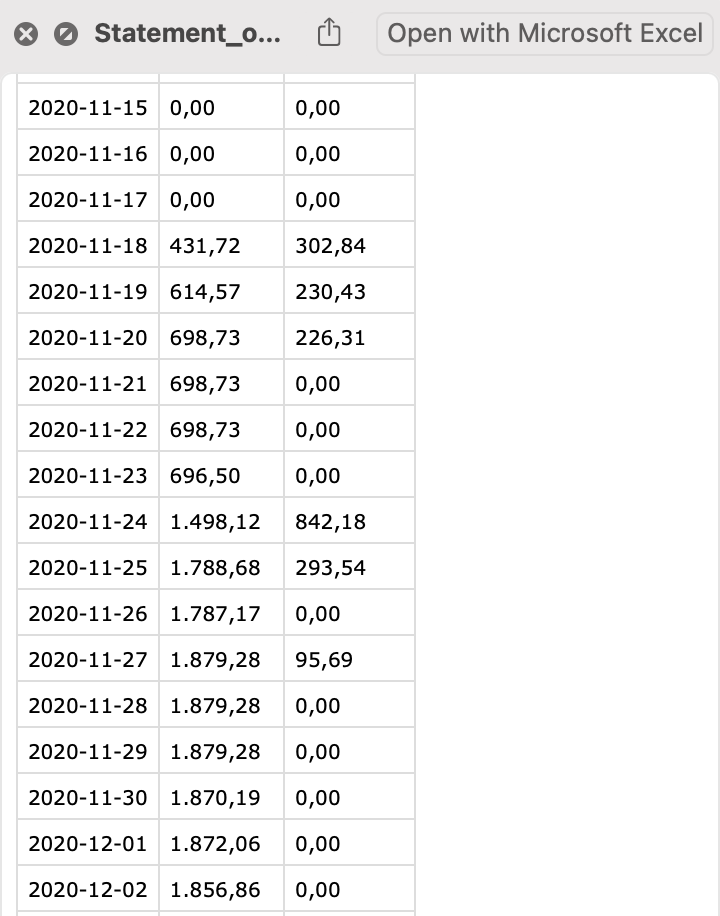
In any case that is the reason for the upwards spike: You bought shares for 302.84 which then, at the end of the day, had a value of 431.42, i.e. +42%.

This was not the case.

I managed to solve the problem. I had to go to my assets and right-click to select a source like yahoo finance for the historical quotes.

Now the plot seems correct

Thanks

A follow-up question. Is there any way to separate the assets but based on the exchange?

E.g. I have bought VUAA ETF in XET and MIL exchanges.

PP groups these as the same. Is there any way to separate them?

One Option is to create two securities for that, but then the automatic import would not work anymore and that does not make sense at all, because it is the same security! The company/security is the same and thats indipendend from where you buy it!

Clear I agree thanks! I was just wondering.