Hi
First of all’ Thanks for your fantastico job. I ‘ m your fan . This morning I tested the new feature regarding price range. It seems not working in fact if i go with mouse on the Line it is displayed % from the max and the min. These seems not correct or i haven’t understood the algoritm to calcolate them :). Can you check ?
Note: also the example presented in the post seems not correct. 33.085 vs. 31.475 is not a - 17.58% ( …. Or really I have not understood the meaning of this kpi).
Please post a screenshot of what you’re seeing, then the explanation of “These seems not correct”. Which are “these” and why not?
Note: also the example presented in the post seems not correct. 33.085 vs. 31.475 is not a - 17.58% ( …. Or really I have not undesrtood the meeting of this kpi).
The percentages shown are numeric representation of the graphics which is shown, which means it’s all in relative terms to the actual range over the specified time. Consider for example an asset which oscillated between 99 and 100 over the last year. If it’s at 99 now, it may seem that it’s merely 1% down in absolute terms. But actually, it’s -100% down from its top, and +0% from it’s bottom over this time, i.e. you caught very bottom of the range. Numeric tooltip exists exactly to help interested parties to catch the actual tops/bottoms vs “close to top/bottom”.
If you want absolute figures, that’s old “Delta” (aka “Change in price”) columns which existed all the time.
1 Like
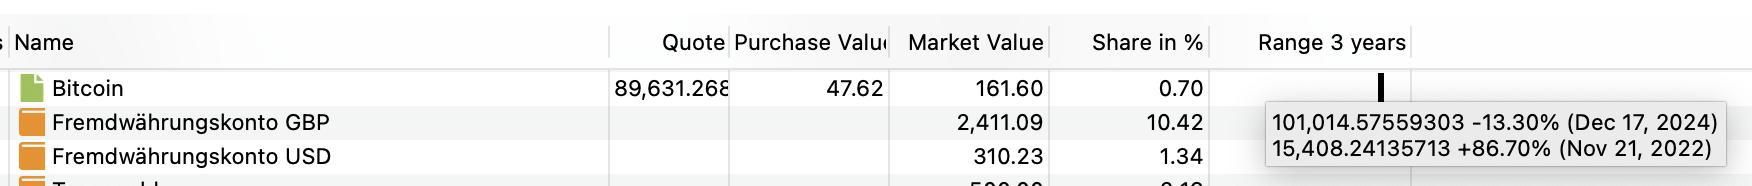
This is how it looks on my side:
In the past 3 years (= the selected reporting period), the lowest price was 15,408 (atl = all time low) and the high was 101,014 (ath = all time high).
At the moment the price is 89,631.
If you place this price in the range between (low → high), then it sits with 86,7% (now - atl) / (ath - atl)
Where the “all time” of course is the “selected reporting period”.
@pfalcon beat me to answer this. Thanks @pfalcon for implementing this feature.
1 Like
I think that the interpretation of now is tied to the last available price within the selected period. For example, if the reporting period is the year 2022, the now price corresponds to the quote on December 30, 2022, which is the last available price for that year.
However, the price displayed in the third column of the statement of Assets view is different. It reflects the price on the date set by the Time Machine, which could be outside the selected reporting period. For instance, if the Time Machine is set to September 12, 2023, the price in the third column will show the quote for that specific date, regardless of the reporting period. See the documentation for an example.