I don't understand the cumulative TTWROR?

This screenshot confuses me :

I exported the THALES performance chart, redid the calculations, and it’s fine. Tonight, I lost €17.02, the IRR is -3.63%, and yet the TTWROR is +1.90%… This defies my logic. How can you lose money on an asset and still have a positive rate of return?
It’s counterintuitive!

It’s a bit late, do you have your answer? Well… Upload the image of your post to ChatGPT and ask him to explain it. “It’s not actually a contradiction — it’s a nuance of return calculation methods.” I will not copy the entire answer here, he explains the “apparent contradiction”.

Better late than never…

I don’t have an answer to my question, so I followed your suggestion to ask ChatGPT. This AI often talks nonsense, especially when it comes to maths, and, in this case, it talks knowledgeably about PP with a lot of errors (for example, it tells me that PP calculates the TTWROR from the chosen observation date, which is completely wrong). In the end, it gets bogged down in contradictory positions and keeps making excuses for repeating its mistakes in the following post… Thanks for the suggestion, but in the end ChatGPT didn’t explain anything to me in a rational and understandable way.

Translated with DeepL.com (free version)

2 Likes

IRR and TTWROR are completely different measures. You should review their definitions and look at some practical examples. It’s entirely possible for one to be positive and the other negative.

IRR (Internal Rate of Return):
This measures the return on your actual cash flows — meaning when and how much money you put in and took out. It accounts for the timing of these flows.

TTWROR (Time-Weighted Rate of Return):
This measures the return of the investment itself, ignoring the timing and size of your contributions or withdrawals. It reflects how the investment performed over time, independent of your cash flow decisions.

Look at the manual… :smile:

Thank you @Topkapi1971 and @Nirus for your explanations and insights, which have helped me understand the concept better.

I think I now clearly understand the difference between TTWROR and IRR, and I have already consulted the manual.

That said, I can’t find a good explanation anywhere, using a concrete example, of how you can hold an asset that is losing money and still have a positive TTWROR (I have no problem understanding IRR, and it is undoubtedly my preferred indicator).

Translated with DeepL.com (free version)

OK, I agree with you, I have a loss of 6, but in this case the TTWROR is -20% and is not positive as it was for Thales in my first message.

Let’s break down your example over 3 days. We have:

Day 1

  • Incoming transfer of 10 (first purchase) and value 10

Day 2

  • Incoming transfer of 20 (second purchase) and value 40

Day 3

  • Value of 24

Calculation of cumulative TTWROR = -20%

I would like a similarly simple example but with a loss and a positive TTWROR.

Translated with DeepL.com (free version)

The TWR is positive, +20%.
First period : the 10 € gains 100% to reach 20 €.
Second period, the 40 € goes down -40%, reaching 24 €.

TWR : (1+100/100) * (1-40/100)=2 * 0.6=1.2 → +20%

Which is also directly the price change from 10 to 12.

TWR does not care that you had more money invested during the -40% than during the +100% period. It cares that you invested in a share that overall went from 10 to 12 € (+20%). Good choice of security.
MWR = IRR does care about it. Bad choice of time to have invested a lot when the shares costed 20€.

Thank you @Veterini for your input.

I took care to calculate the TTWROR as indicated in the manual, but I did not get the same result as you.

To be sure, I created a file based on our simple example, which I have included below:

  • Cash account with €30

  • 7 August 2025 = purchase of one share at €10 => price €10, value €10

  • 8 August 2025 = purchase of another share at €20 => price €20, value €40

  • 9 August 2025 = no purchase => price €12, value €24

Here is the PP screenshot for this example:

The loss is €6 and the TTWROR is -20%.

EDIT: Additional screenshot

If you have 30 € cash from the start, I think this means that for the first period, instead of going from 10 to 20 (+100%) you go from 30 to 40 (x1.333 = +33.3%)
Then second period is the same, 40 to 24, -40%.

So 1.333 * 0.6 = 0.8 → -20%

To get the 20% you can :

remove the cash deposit and go to delivery inbound instead of Buy

Or
Apply the TWR on the security only

Or (maybe)
add the cash deposit on the same day than the purchase, 10€ on the day of the purchase, 20€ on the other day of the second purchase.

Here we are having fun trying to figure out how PP can give us +20% instead of -20%… But in real life, I credit my cash account, I make my purchases and ultimately I look at what that means in terms of indicators such as TTWROR. If we have to come up with strategies to achieve a particular result, I find that very questionable.

I did test your hypotheses, though:

  1. Withdraw the cash deposit and switch to incoming delivery instead of buying => result = -20%

  2. Apply TTWROR only to the share => result = -20%

  3. Add the cash deposit on the day of purchase. €10 on the first day, €20 on the second day => result = -20%

PP always gives me the same result of -20%

Look at the second screenshot from my previous message on how PP calculates TTWROR

And what if you space the purchases a with a day without purchase ? If on the same day the stock change price from 10 to 20 and you do a buy, maybe it can give strange result.
1/ purchase for 10€
2/ stock goes up 20€
3/ second buy at 20€
4/ stock falls to 12€

Each step clearly separated by a day, a week etc.

Before going into the real life cases, the goal is to explain the meaning of the TWR and why it can be positive while you have a loss.

The one-day gap between the first and second purchases does not change the result, which is still -20% overall and on the share price.

Hmm, and the historical quotes of the security is updated to 20 one day or more before the second purchase ?

If each step (price change, investment) is clearly separated and you do not start with 30€ cash from the beginning, you should get the +20%, not -20%.
Maybe I am missing something, I do not have laptop at the moment, will test in two days.

OK, I have to leave for the rest of the day.

Have a nice Sunday.

sansnom.xml (13,4 Ko)

In this file, the different steps (purchase, price change) are correctly spaced.
You had a different result, -20% because you got into a specific case (very high change price the same day of an investment).

You can exacerbate the difference between TWR and loss : instead of purchase 1 * 10 € and 1 * 20€, purchase 0.1 * 10 € = 1 € and 10 * 20 € = 200 €. The TWR will still be +20% but the loss much more. If you understand why, you understand TWR.

Hello @Veterini,

I’m sorry to say this, but I find this indicator appalling. If we add the TTWROR p.a., the combination is far from convincing. Let me explain.

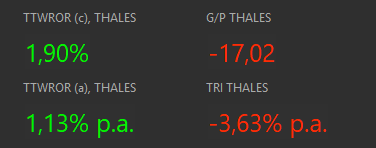
On the TTWROR (I’m using the data from your xml file)

As can be seen in the three tables side by side, the TTWROR is +20% (left and right tables), which is correct given the price increase from €10 to €12, if, and only if, purchases are made before 1 February (at €10 in this case) or after. A purchase on 1 February gives a variable result depending on the change in price between the previous day and 1 February. With a change of 10/20/12, the cumulative performance is 33.33% instead of 100% for purchases before or after 1 February. But the anomaly is not limited to the doubling of the price between 31 January and 1 February. If the price increases by 10% (or any other number to be tested), the cumulative performance is 4.76% and the final TTWROR is 14.29%. This is not 20%, which should be the case since the price rose from £10 to £12.

In a real-life situation, our simple example does not apply, and it is very often the case that we buy at a higher price than the previous day, or at least a different price (I have not tested a falling price, but I imagine the results would be similar). As soon as the price rises compared to the previous day and we buy, the TTWROR does not reflect the reality of the price change (+100%, +10%, etc.). This is simply because the incoming transfer in our example is taken into account when calculating the TTWROR. Still in our simple example, the TTWROR is accurate (+20%) if and only if the price has not changed from the previous day, which almost never happens.

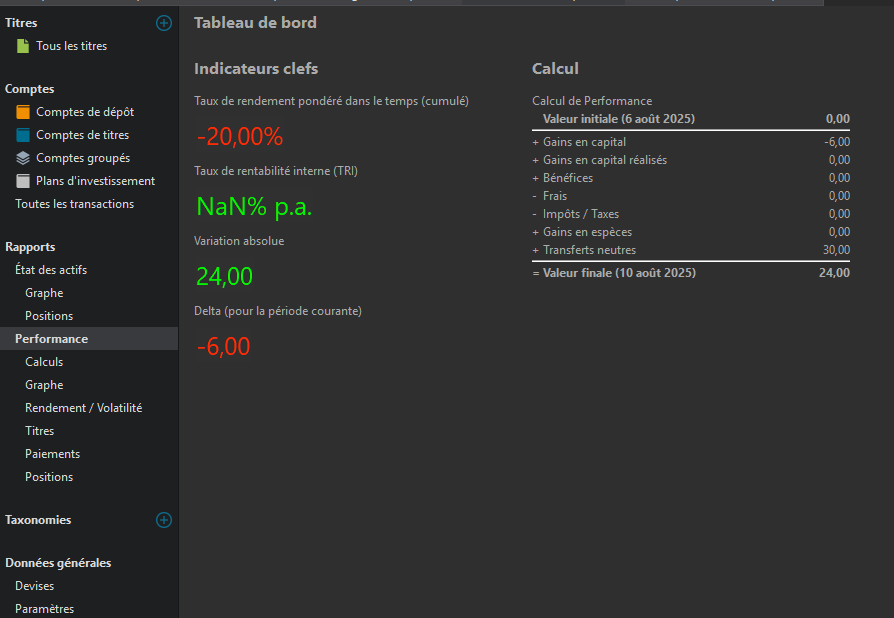
In a previous message, you told me: “TWR doesn’t care that you invested more money during the -40% period than during the +100% period. It cares that you invested in a stock that went from €10 to €12 (+20%) overall. Good choice of stock.” This is not what we observe in reality. The TTWROR is in fact +20%, but an anomaly creeps in on the day of purchase when a change in price has occurred. And quite seriously, unless I am completely misunderstanding and am hopelessly confused, a TTWROR that displays an inconsistent result, totally dependent on the rise or fall in the price compared to the previous day, does not seem to me to be either reliable or serious. Ultimately, how can we interpret the TTWROR for the entire portfolio, knowing that it combines all the TTWRORs of the securities in the portfolio with the anomalies we have just seen? At the moment, the TTWROR for my portfolio is 71.03%. What can I deduce from this? The IRR is 32.12%. This makes sense to me and I am able to recalculate it in LibreOffice based on cash flows.

On the TTWROR p.a.

Here too, I don’t really understand the result. The TTWROR p.a. is calculated based on the length of the observation period. For me, that’s 1 November 2023. So all the lines in my portfolio are calculated over this observation period, even if I have only held them for a few weeks or months. A TTWROR p.a. calculated over 22 months with lines held for much less time. I don’t understand the relevance of the result.

I hope DeepL will translate my words and their nuances correctly.

En français = Après relecture après traduction, c’est loin de bien correspondre à mon propos

Translated with DeepL.com (free version)

Hello,
Initially, the goal was to provide an example with a positive TWR while the investment was losing money. I think now this is clear, right, such case can arise when, despite an underlying investment vehicule with rising price, your investments can be of different sizes and if there is a large invested capital just before a large fall / a small invested capital before a small rise, then money can be lost.

A good vidéo in french :

(And the channel has also tutorials for PP)

Then, there is the implementation in PP, which is I understand where you are now focusing on. To calculate TWR you have to subdivide the period of study into sub periods and compute the return on each sub-period before geometrically linking them. When a inflow/outflow (such as purchase/sale) occurs, you should know the portfolio value just before the inflow to be able to get the sub period return : (value just before the inflow/value at the beginning of the period) - 1. One key part is that while PP has the past historical prices, it has only those. And those historical price are the closing price of the day.
So unless I am mistalen, what PP does is to use sub-periods of 1 day and consider the inflows at the beginning of the day and the outflows at the end of the day. For each day the daily return is (Value of the end of the day/Value of the beginning of the day) -1.
So to evaluate ‘beginning of the day’, it has to consider the closing value at the end of the previous day. When the historical price is updated to 20 on 1st Feb, it means 20 as closing price of this day, not before. Without a purchase, return of the day is 20/10 -1=100%. With the purchase on this day it is 40/(20+10) - 1 = 33.3%. the 10 (value of the portfolio just before the purchase) is not yet update to 20 because the price change is at the end of the day. If you want to modelize “stock rise to 20, new investment of 1 share at 20”, the price update (=historical quotes) should happen before the purchase, not after. If you do both on the same PP day, the price update happens after the purchase as it is a closing price.
I do not have PP with me, so I may be mistaken, but :
If you consider
1st Feb : historical price update to 20
2nd Feb : purchase at 20 and historical price update to 22.
You should still get +20% I think while you had a change of price. You can change the ‘22’ to other number I think you will keep the 20%. Does this really seems that far from a real case ?
But I think yes, if the purchase price is very different from historical prices, you get approximation. But not on the scale of this example which is extreme.

And I do not think it is worse for the full portfolio (I am not sure what you mean by ‘combining TWR’, the TWR of the full portfolio is calculated based on the amounts of the full portfolio directly, not by a formula combining individual TWR). Try, if you slightly change the historical price of the day (or before) of an investment on your real case, do you really have a value much different from your 71% ?
[On this topic of full portfolio, I think I have to correct myself : when you consider several securities, then here the amount of the investments do impact the TWR of the total portfolio]

I keep putting it off, but I have to admit that the unexpected, important and urgent tasks that have fallen on me over the past week are taking up all my time, and PP is not my priority right now.

Thank you, @Veterini, for your concern for education and, just as much, for your patience.

I am a septuagenarian, and my brain cells probably don’t work as well as they used to.

When things get back to normal, I’ll need to revisit how TTWROR is calculated based on the various situations we’ve already discussed and how this calculation appears in the CSV Performance>graph>export export.

The devil is always in the details, and I think the calculation of TTWROR is no exception.

See you soon,

dregnier

Translated with DeepL.com (free version)