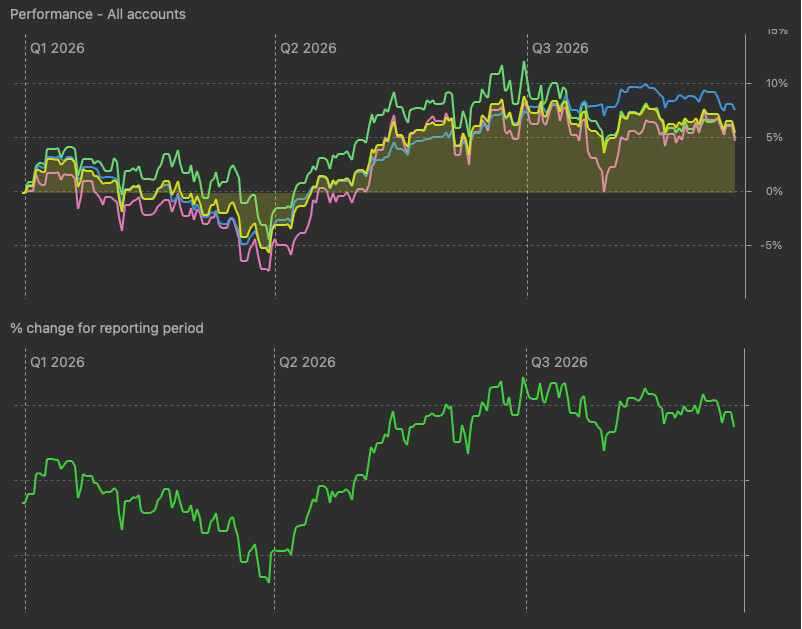
When I look at the YTD performance of my portfolio, the graphs in the mobile app differ from those on the desktop. In particular there are two huge spikes on February 16th and again on April 1st 2026.
Is there any way I can remedy these errors in the mobile application?
I’ve made a 10 year lookback, and these two spikes are the only ones that appear in the mobile app.
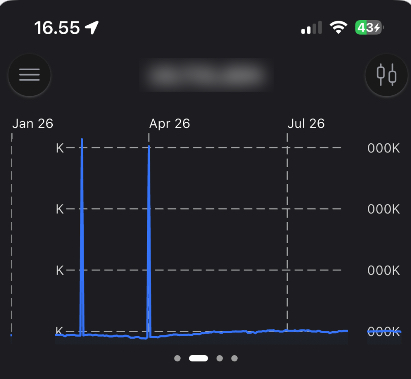
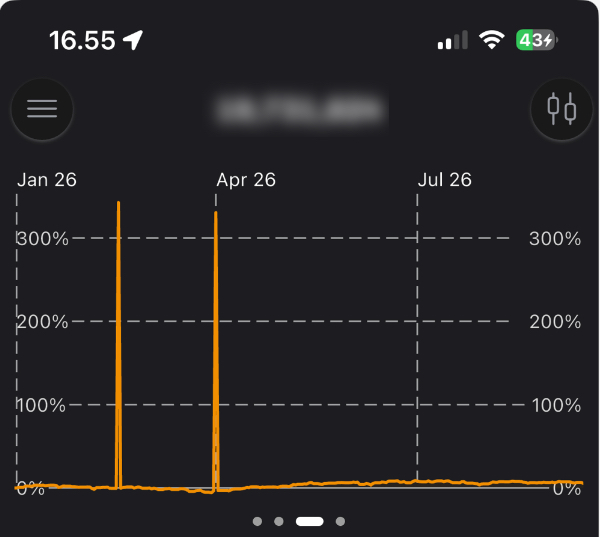
It appears that there is an issue with the quotes.
From a distance, it is challenging to debug this problem.
First, I recommend investigating the received quotes on your desktop to verify that they are correct.
If you find faulty once on your desktop, delete and correct them. Don’t forget to resync.
If your desktop version is fine, check for the quote source.
The following sources are supported by the mobile app:
- Built-in
- Yahoo Finance
- Yahoo Finance Adjusted
- HTML (Tables on websites)
- JSON
- CoinGecko
- Eurostat HICP (Inflation data)
If your desktop version is fine, it is likely that the built-in provider has some incorrect data around your spike date.
Thanks Sn1kk3r5
I fiddled around a bit and created a new 5-day interval in the mobile app around one of the dates that showed a spike. The 5-day graph didn’t have any spike, and when I turned on the YTD chart, everything was OK. This exercise seems to have solved the issue. Now it looks correct on all the intervals I have in my mobile app.
On that note: Is there any way to delete this newly created 5-day interval from the mobile app?