Hi all,
First of all, thanks a lot for this great app. I’ve moved all my portfolio to it and I’ve been tweaking it in the last days. It works incredibly well.
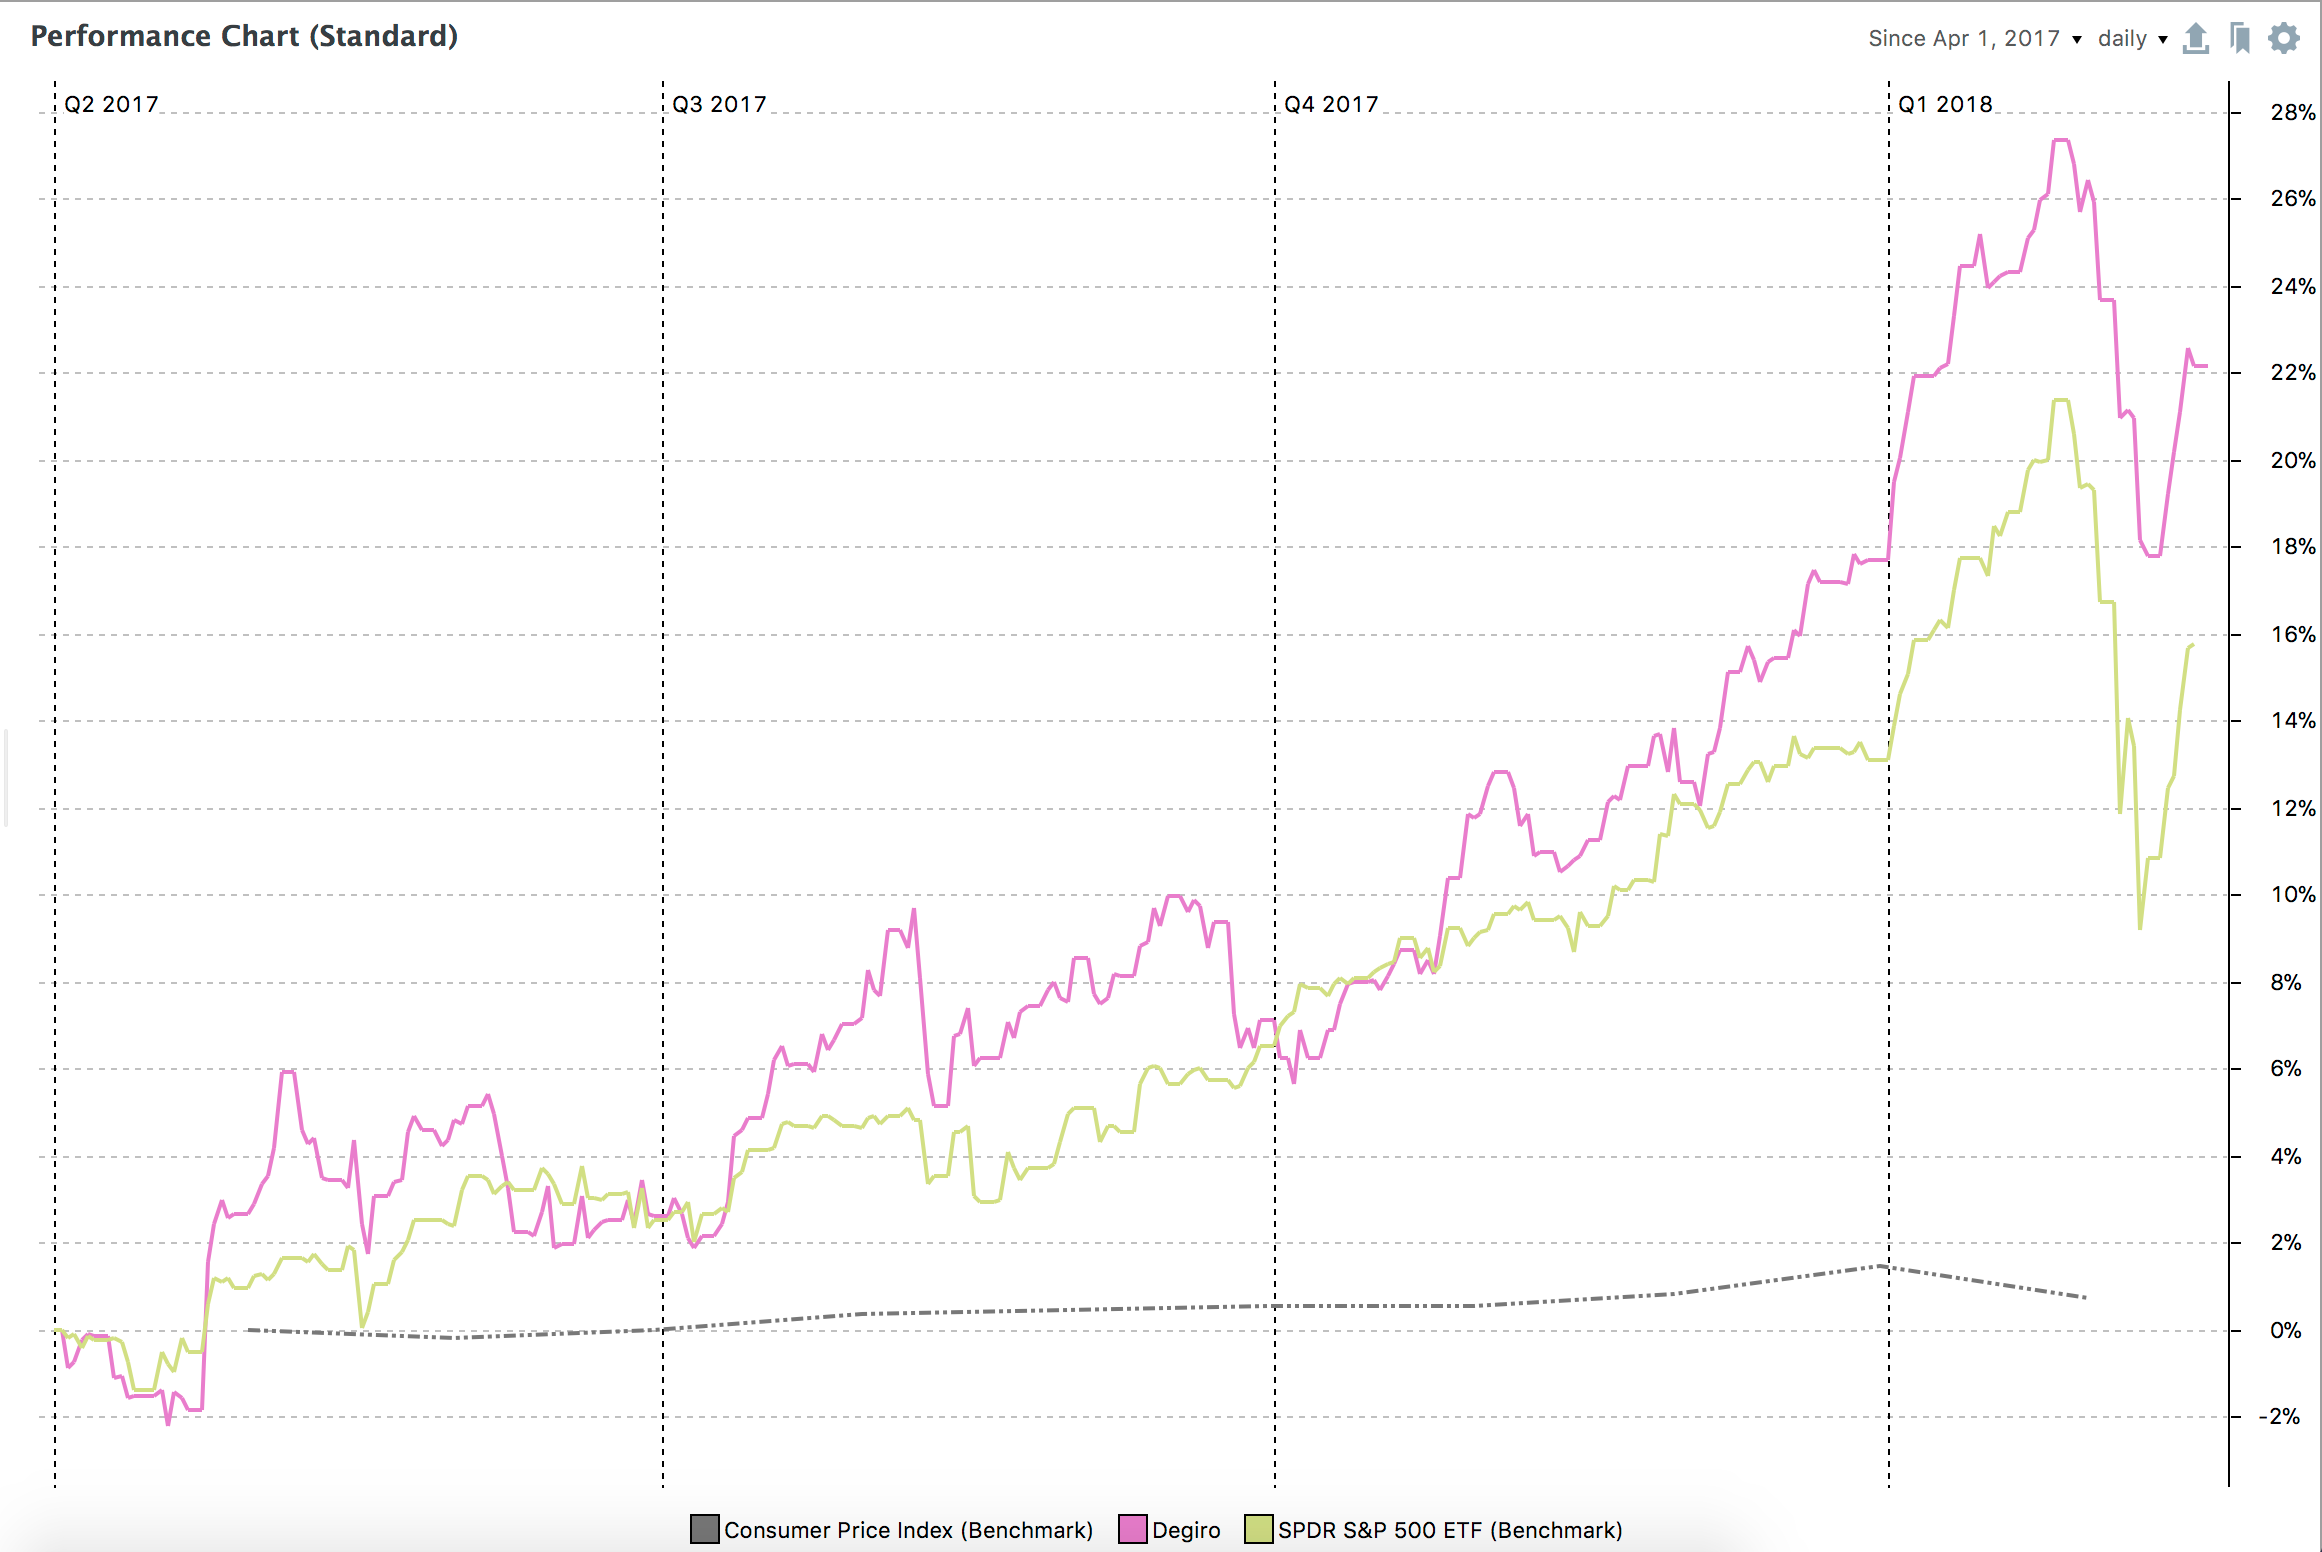
But I still have issues understanding some data. In the Performance>Chart view, I use the SPY etf (SP500) as a benchmark:
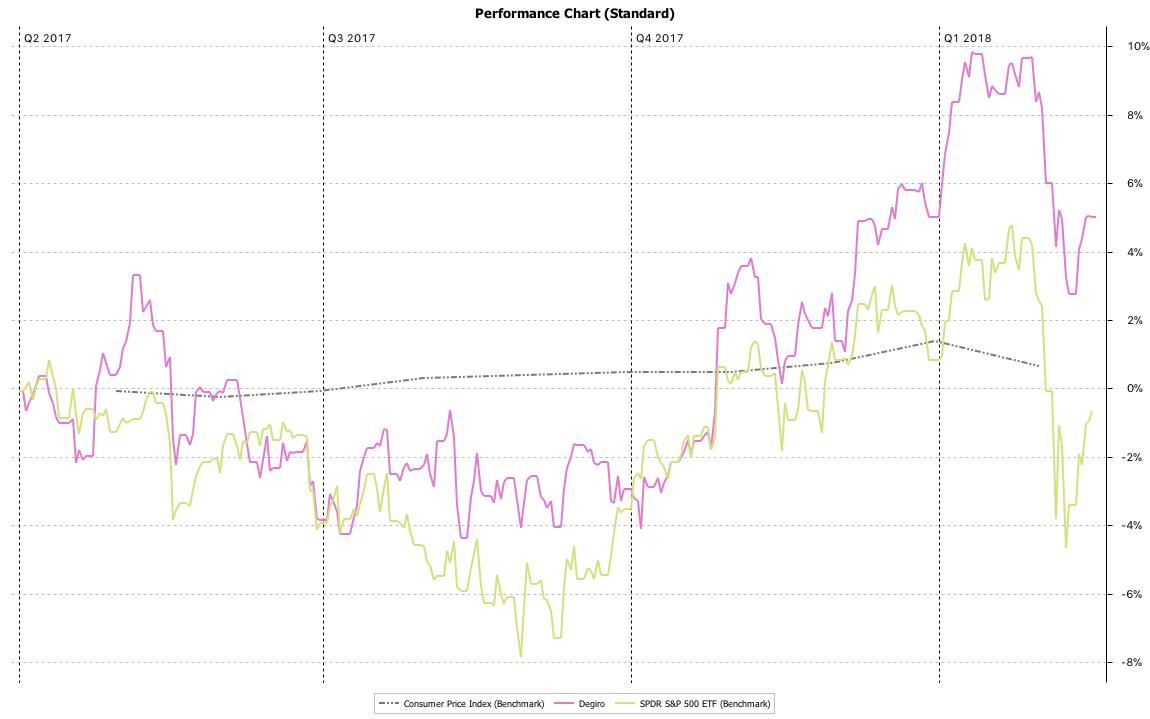
If I understand this correctly, it shows that the performance of the index has been negative in the period April 1st 2017 → February 17th 2018, which I believe it’s wrong (it’s been around +15%).
What am I missing?
Thanks!