Hi to all,
I want to ask for advice.
I started using a wonderful application. It’s beautiful.
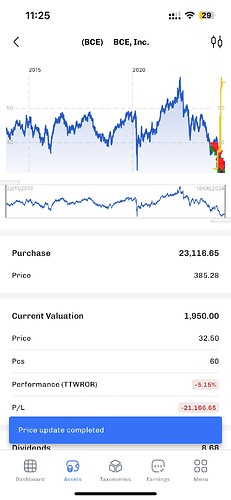
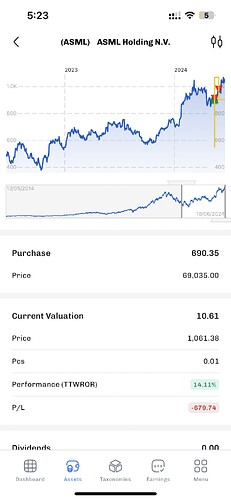
But several stocks (8 out of 90 in the entire portfolio) have something strange displayed in the statistics. Incorrect figures - purchase, price, PL & TTWROR.
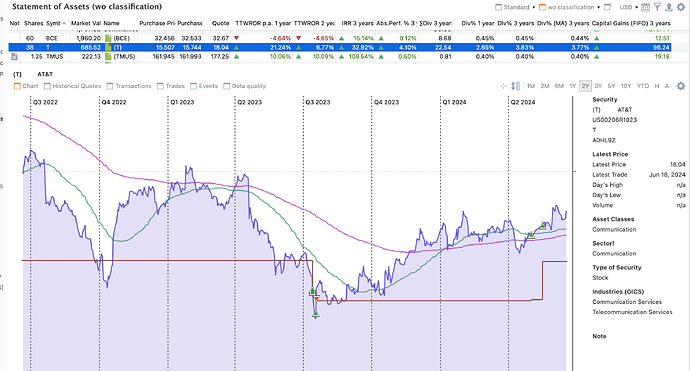
At the same time, everything is displayed correctly on the desktop.
Maybe someone knows how to fix it?
In your app you’re calculating TTWROR for a different time than on your desktop.
Cheer
Hi Sn1kk3r5
I would be very glad if that were the case. All remaining shares are displayed correctly.
The main thing is that I can’t find a pattern. There are stocks that have been without movement for a year, and there are stocks that have been without movement for three years. All this is very frustrating…
For example I attached extended screenshot
Compare your reporting period.
You are not showing them in your screenshots, but the are obviously different. As your app shows 2015 and longer.
Cheers
The period is the same everywhere - 2Y.
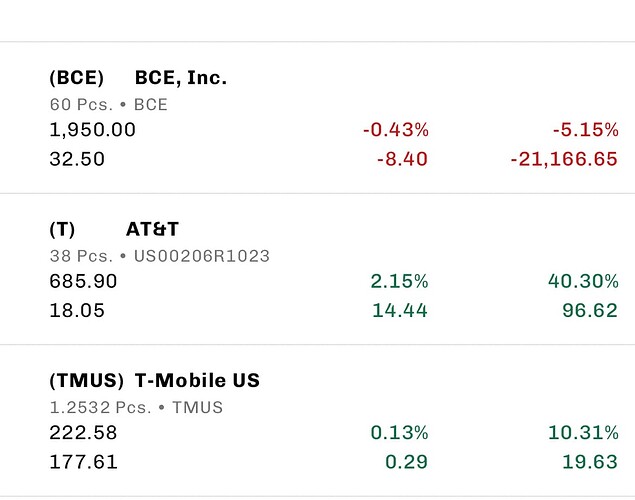
If we look at three stocks in each screenshot, then we will see that the two stocks have the same PL, respectively. The differences are most likely in the commission taken into account.
- ATT - 96.2 (mobile app) / 96.24 (desktop)
- TMUS - 19.63 (mobile app) / 19.18 (desktop)
and for BCE it does shows a cosmic large and incorrect value.
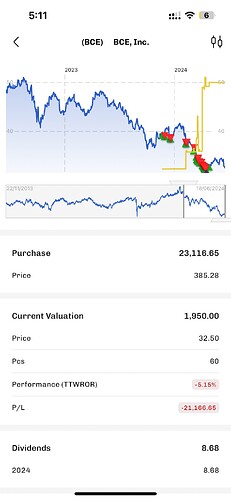
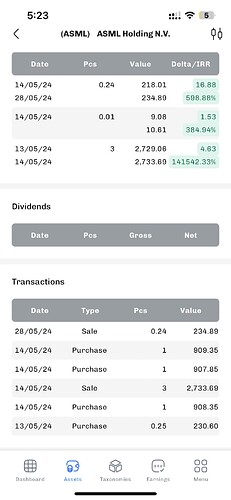
Another example, more clear for postmortem - stock with just 6 transaction

