I have both stocks and crowdlending in PP. Under Chart I would like to show the invested capital only for the crowdlending portion of my portfolio. I already have the crowdlending portfolio as a data series, which works fine.
Also is the same possible with the Transferals?
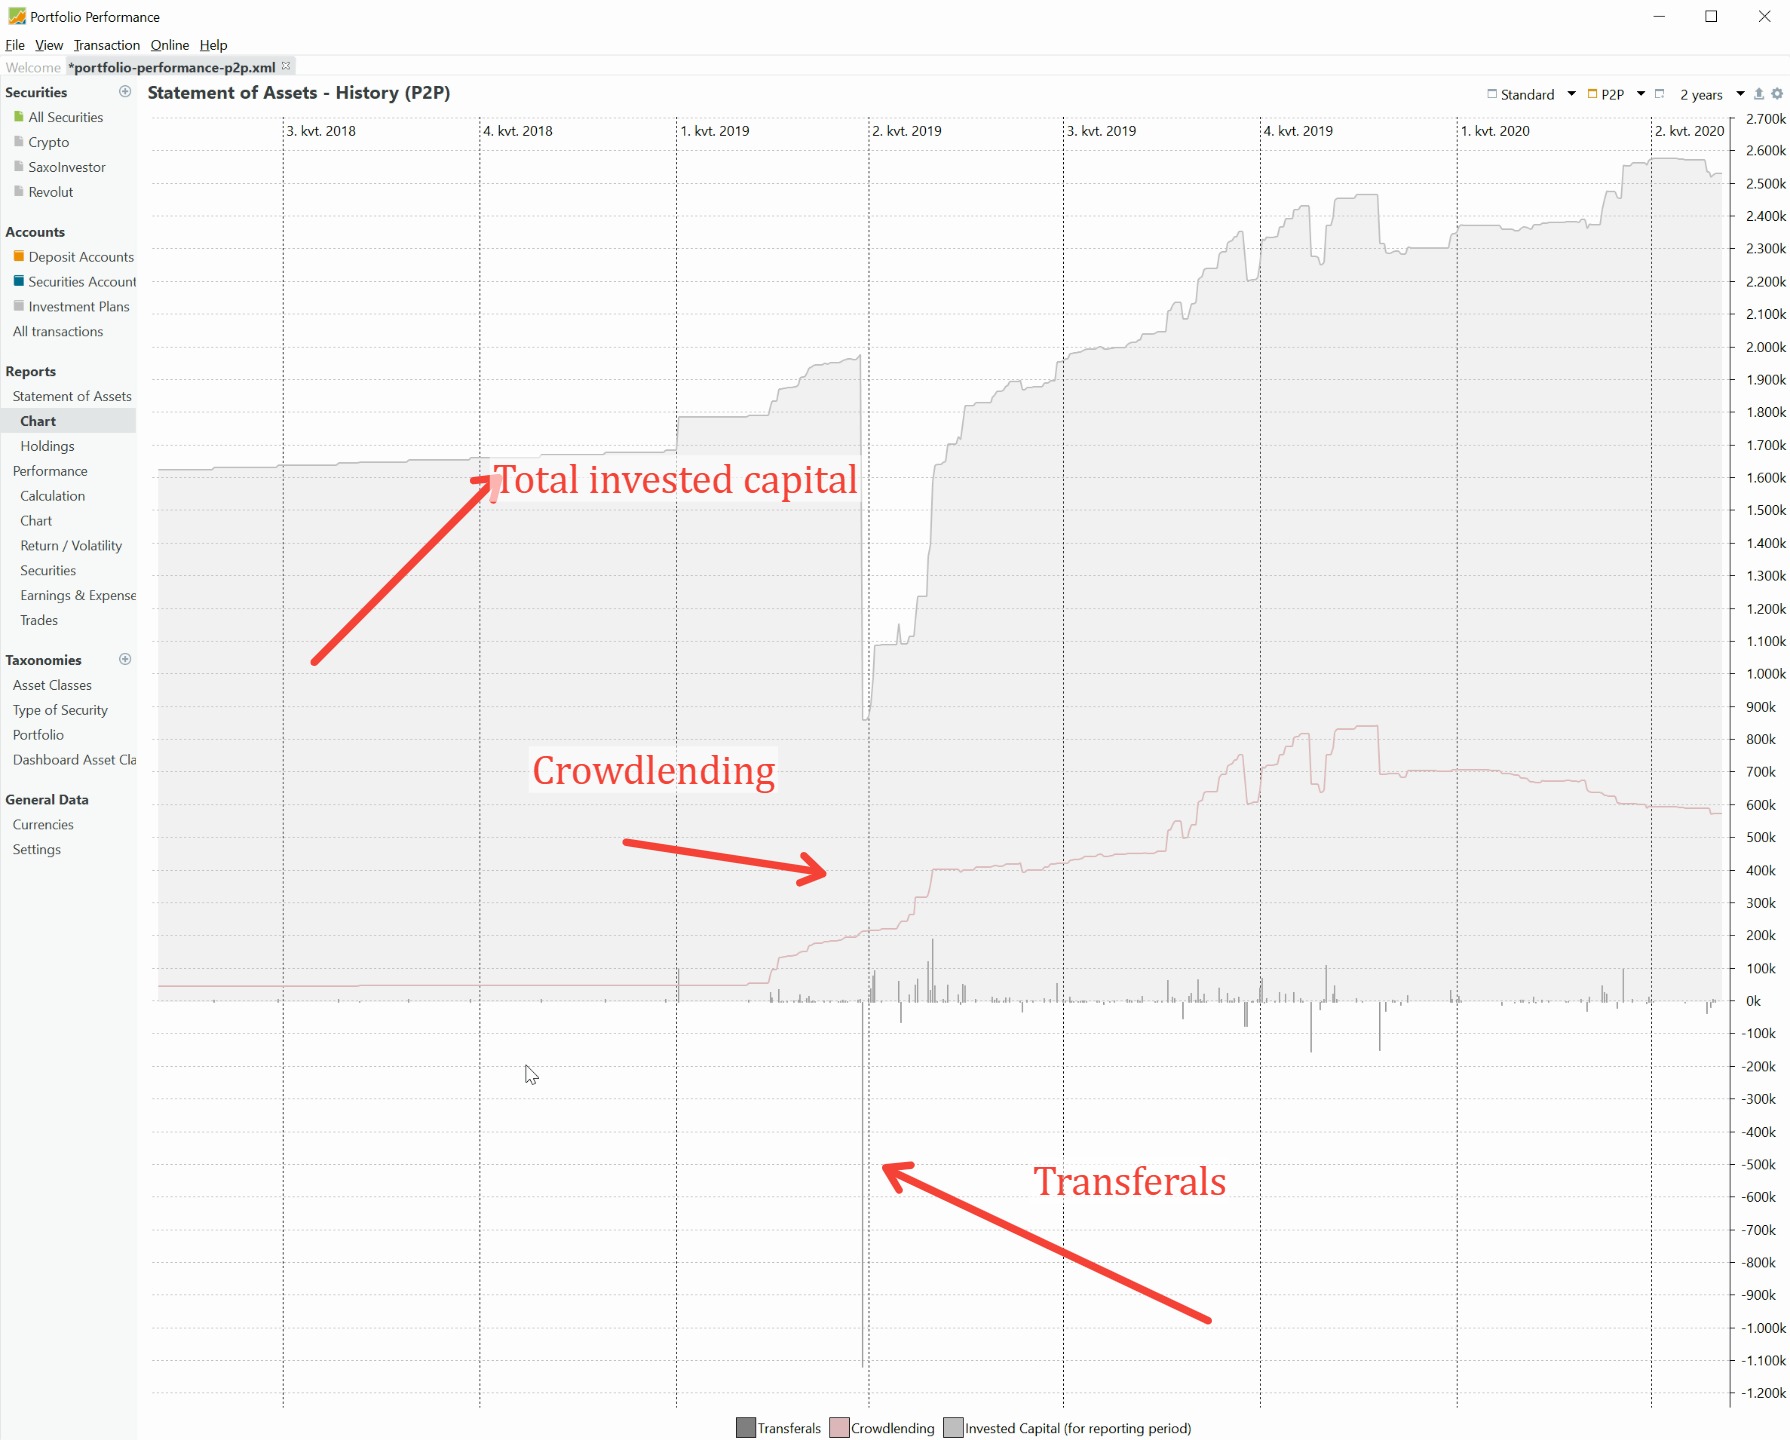
Hey Isolesen,
you can add or remove data from the diagramm using the cogwheel in the top right corner. For instance you can chose from the Taxonomies you created for your portfolio.
As far as I can tell that does not go for the Invested Capital (or how can I add a taxonomy which only holds the invested capital?) I tried to create a new taxonomy and choose only the deposit accounts that has something to do with crowdlending, but that does not give me the correct result for the total invested capital i crowdlending? When showin the two curves it does not correctly show the difference between the total value and the earned interest (it shows 100.000, but in reality it is closer to 5.000). Is it because I cannot just use the deposit accounts to show the actual invested capital?
Hello Isolesen,
I am not so familiar with taxonomies, but can’t you create a classification „Crowdfund“ and categorize the investments by this category? Then you should be able to select to show all crowdlent in the diagram.
Such as under /Taxonomies add Asset Classes, under „Asset Classes“ add the classification „Crowdfund“. After that you can add /Taxonomies/Asset Classes/Croswdfund in the data of the securities.
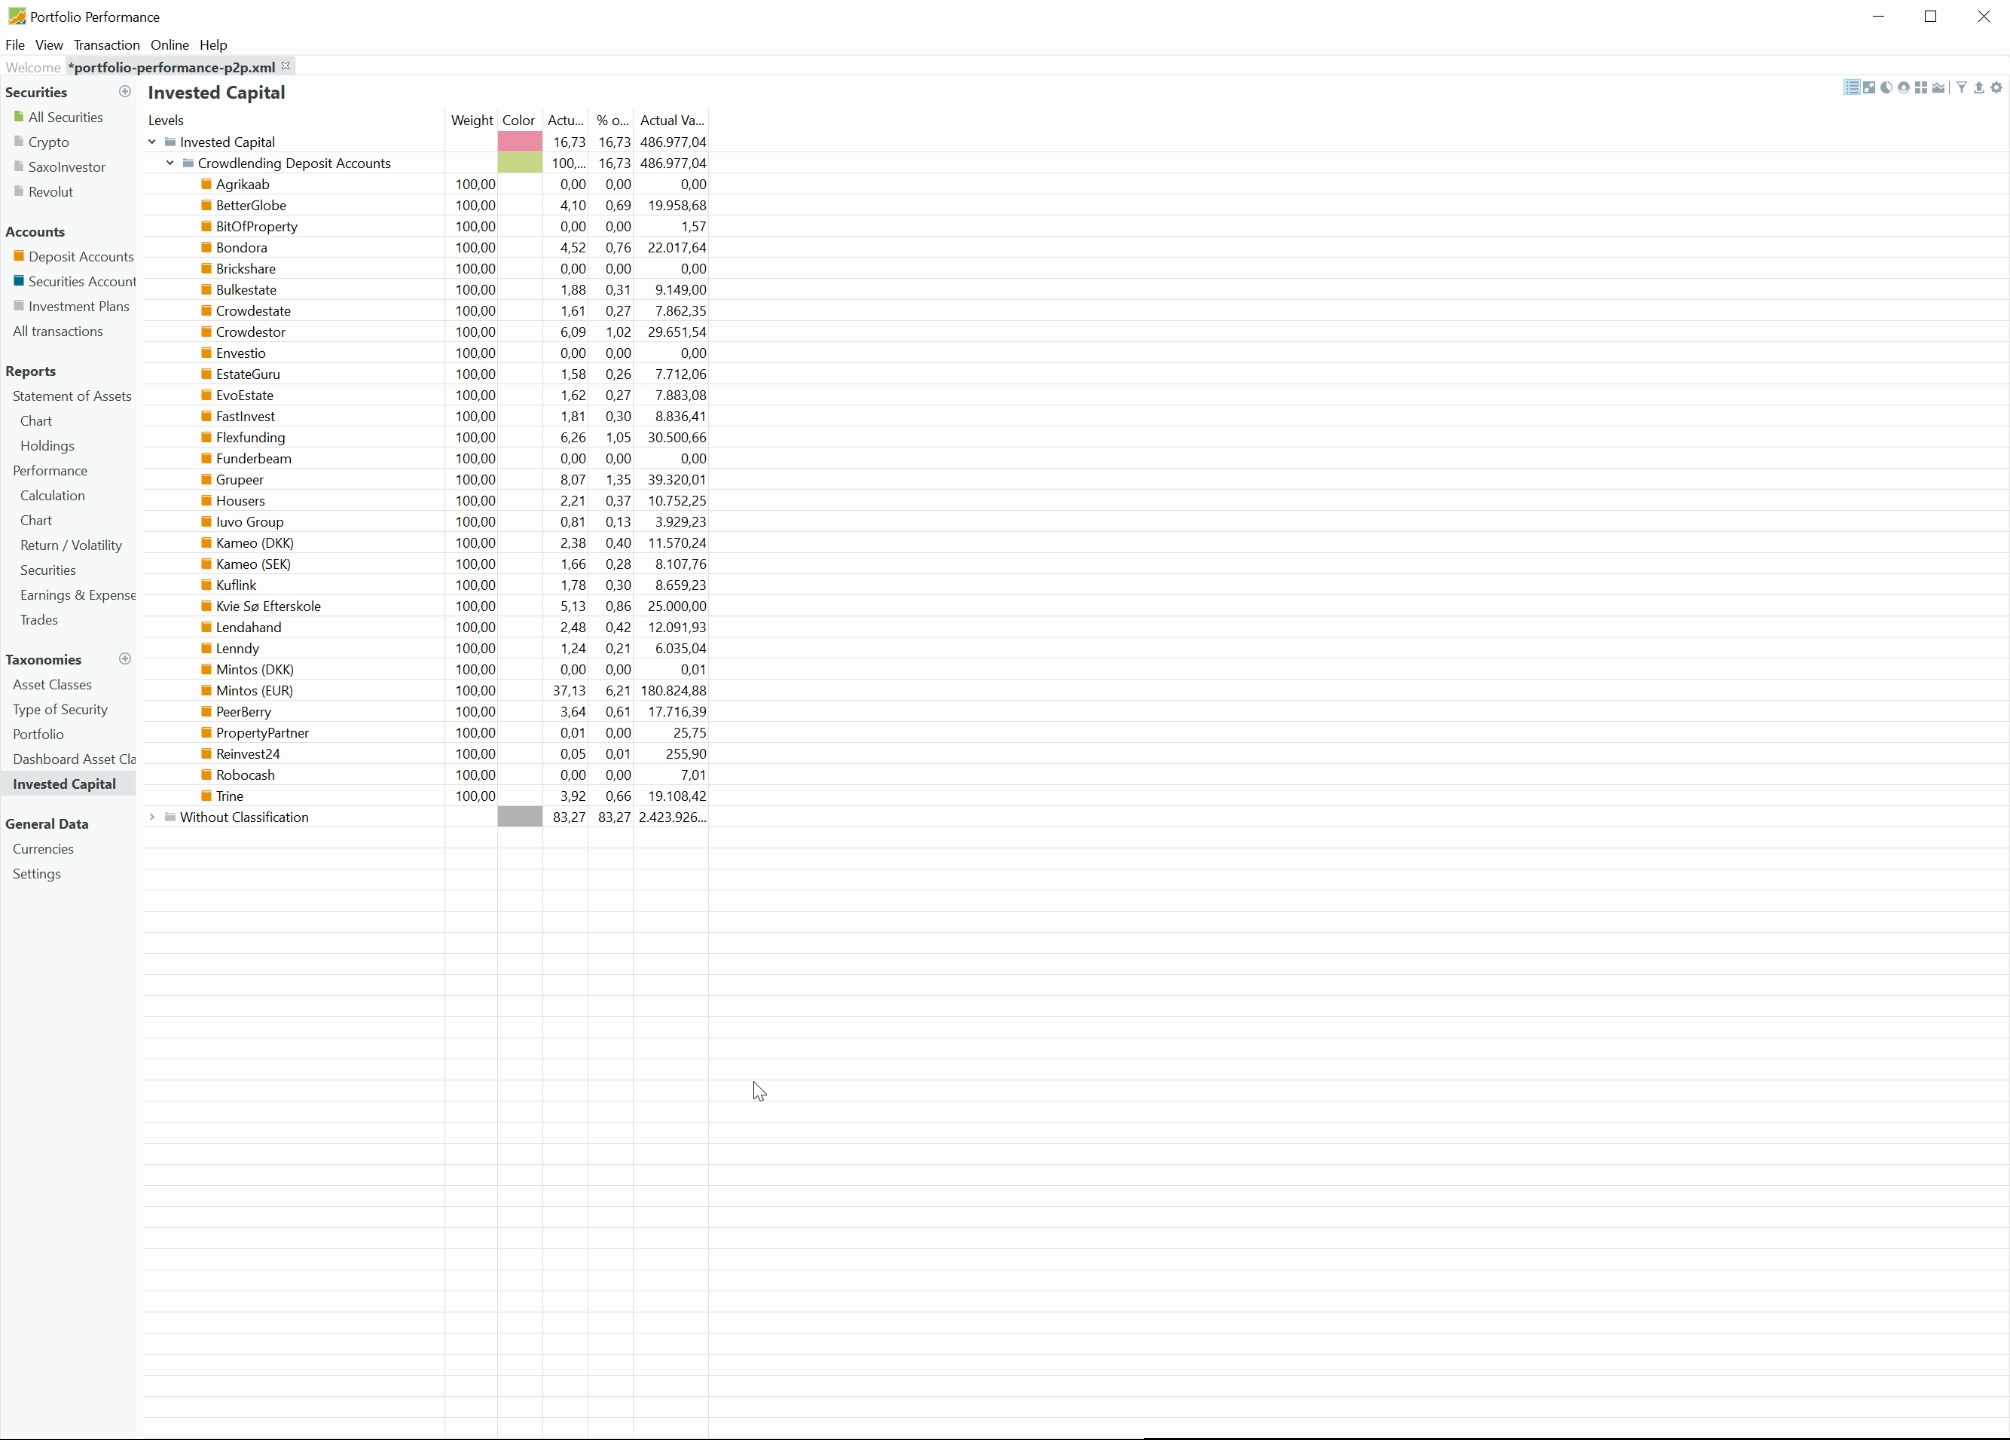
Solved with category „Crowdfund“ in /Taxonomies/Asset Classes and pointing one security to /Taxonomies/Asset Classes/Crowdfund:
Ah, I see, you do organize the crowdfunding via accounts rather than securities.
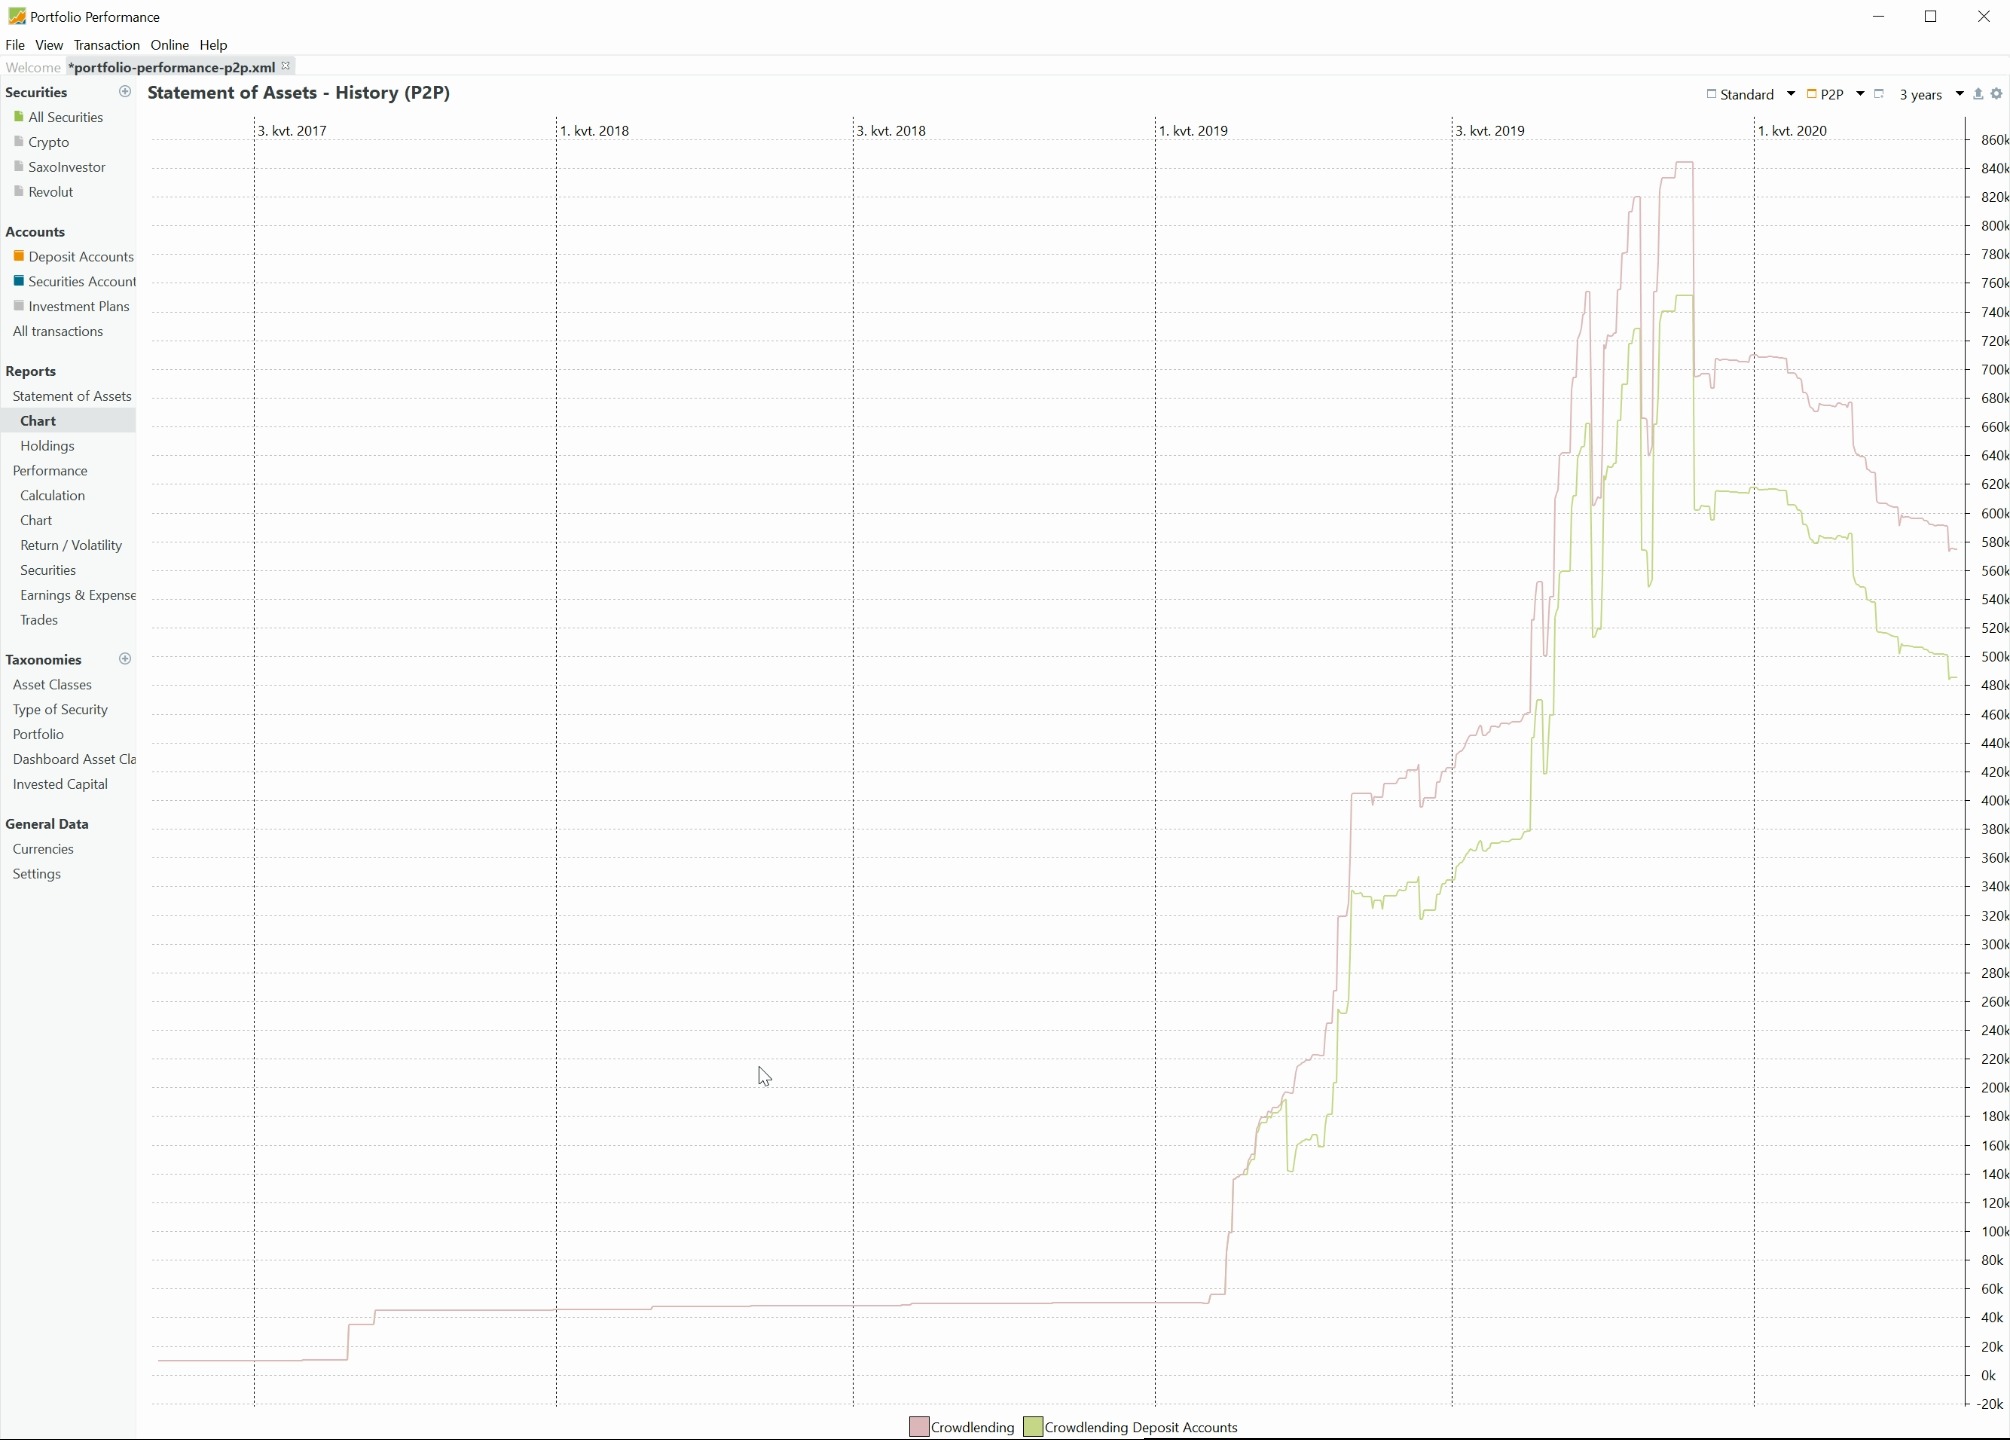
It seems to work, or are you asking why there is a gap between green and red?
The gap is too big, if the „crowdlending deposits“ (which holds all deposit accounts) and the „crowdlending“ (which holds all deposit accounts and securities connected to crowdlending). All in all, maybe what I earned is 10.000, but the gap between the lines are 100.000.
since the two curves pretty much run in parallel I recon that you forgot to include one or more accounts into „Crowdlending deposit Accounts“ … or have one or more to many in „Crowdfunding“
I have double checked.
I think it is that the deposit accounts does not only have the invested capital and that messes up the picture somehow. Or something happened in march 2019 where the deposit seems to drops significantly.
I figured out what created the difference. Most of the crowdlending sites are created like deposit accounts. I have a couple where I buy actual shares. Those are categorised as deposit accounts with a security account. In march I deposit 50.000 to an account - and then I buy a security for 50.000. Then the difference on the two graphs starts gapping with 50.000 more. So the only reason why the two lines are different is the securities bought. Therefore the problem is that it is not just the invested capital, when I put together all the deposit accounts, but also with the interest income and so on. 
It can also be seen before 2019, where I only have an investment in one crowdlending site. And thinking about it the two groups before 2019 is completely alike (and therefore the problem i still that I cannot just choose the invested capital for a group.