Hi,
wenn ich mir bei der Wertpapierübersicht einen Index auswähle (von dem man natürlich keine Papiere hält und auch noch nie gehalten hat) und als Zeitraum “H” aktiviere, wird beim Kursdiagramm ein leeres Diagramm über einen Zeitraum von 50 Jahren angezeigt:
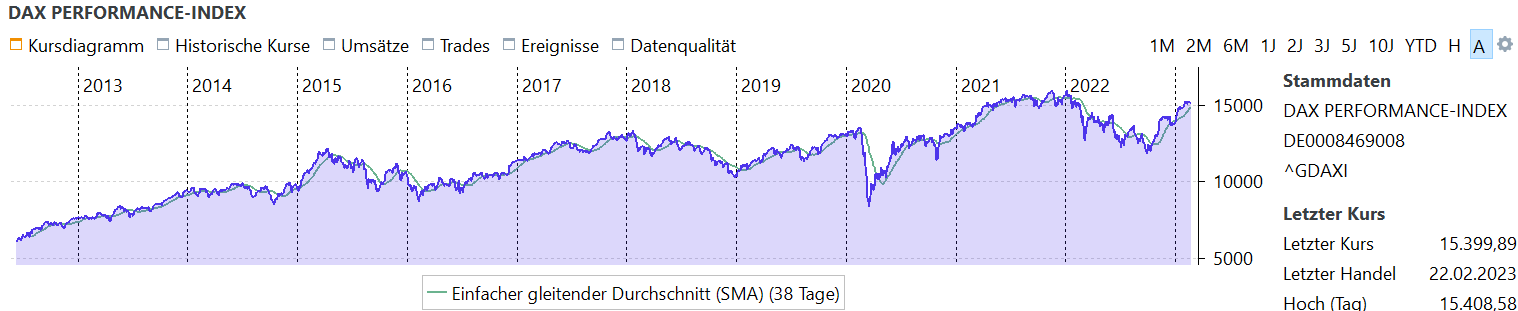
Ich habe die historischen Werte zurück bis ins Jahr 2013.
Ich würde ein leeres Diagramm ohne Zeitangabe erwarten, oder zumindest ein Diagramm ab 2013, wenn man schon 50 Jahre anzeigen will.
1 Like
@kimmerin : Vielen Dank für deine Meldung.
buchen:master ← OnkelDok:holding_period_index_fix
opened 07:35PM - 23 Feb 23 UTC
https://forum.portfolio-performance.info/t/kursdiagramm-zeigt-50-jahre-zeitraum-… an-wenn-man-einen-index-anzeigt/23283
The current solution displays all prices when no transaction is available to determine the holding period.
So with this solution also for normal securities without transaction all prices are shown now. I'm not sure if this is OK.
The alternative would be to first check if the security is an index and then call the new function ``getAllPrices``. What would be an indikator for an index? ``security.getCurrencyCode() == null``?
Wird vermutlich mit der nächsten Version behoben sein.
2 Likes