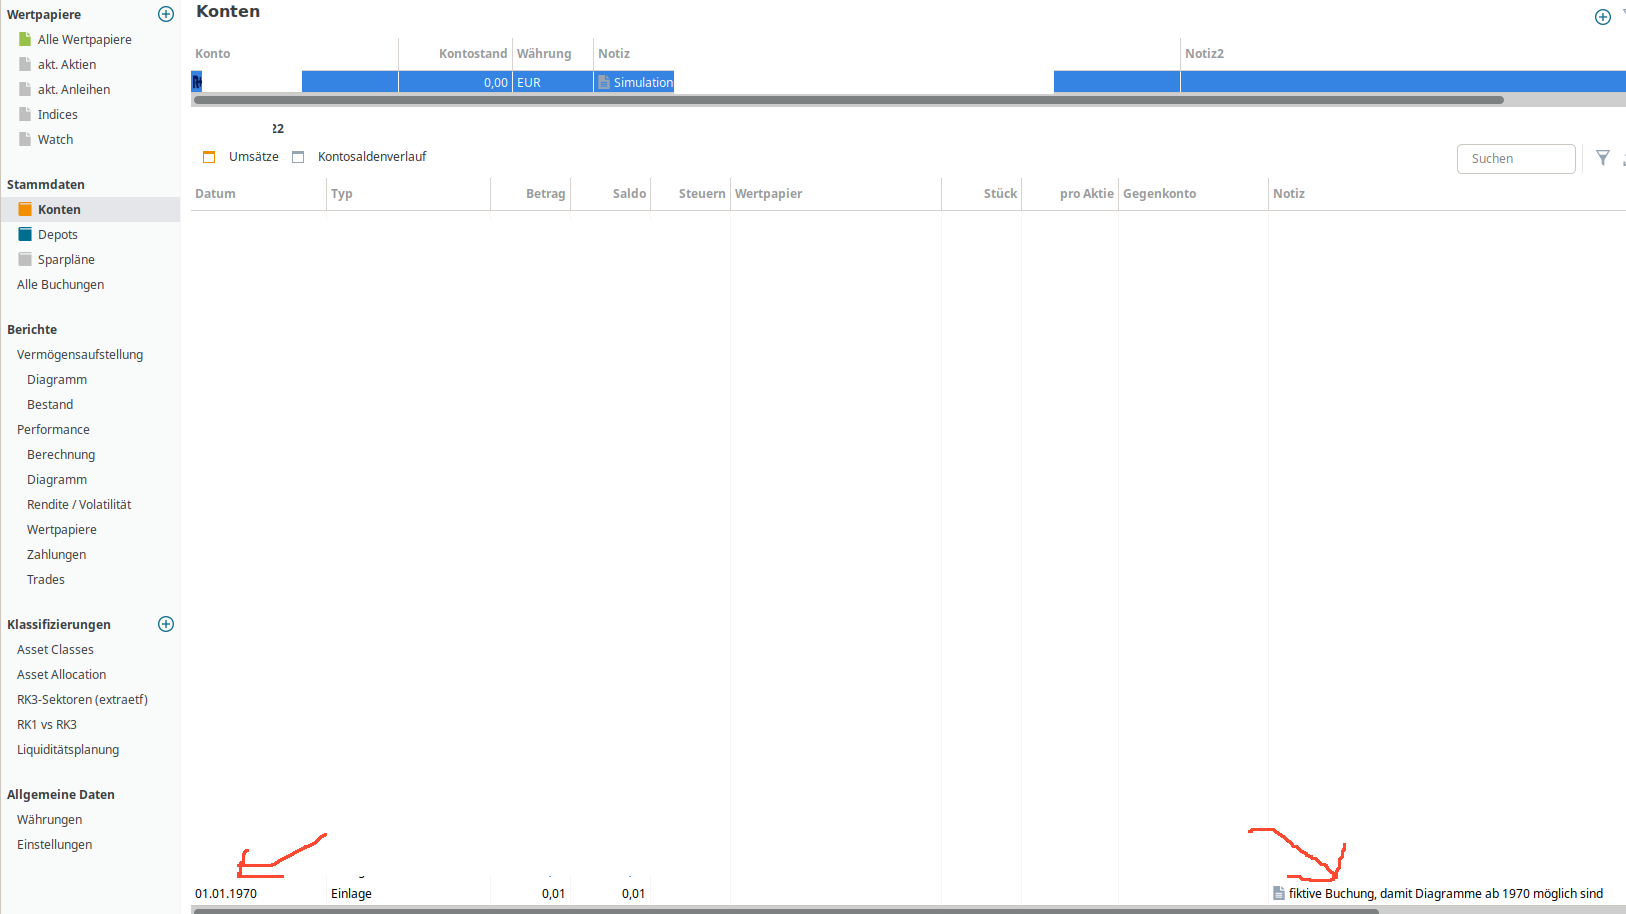
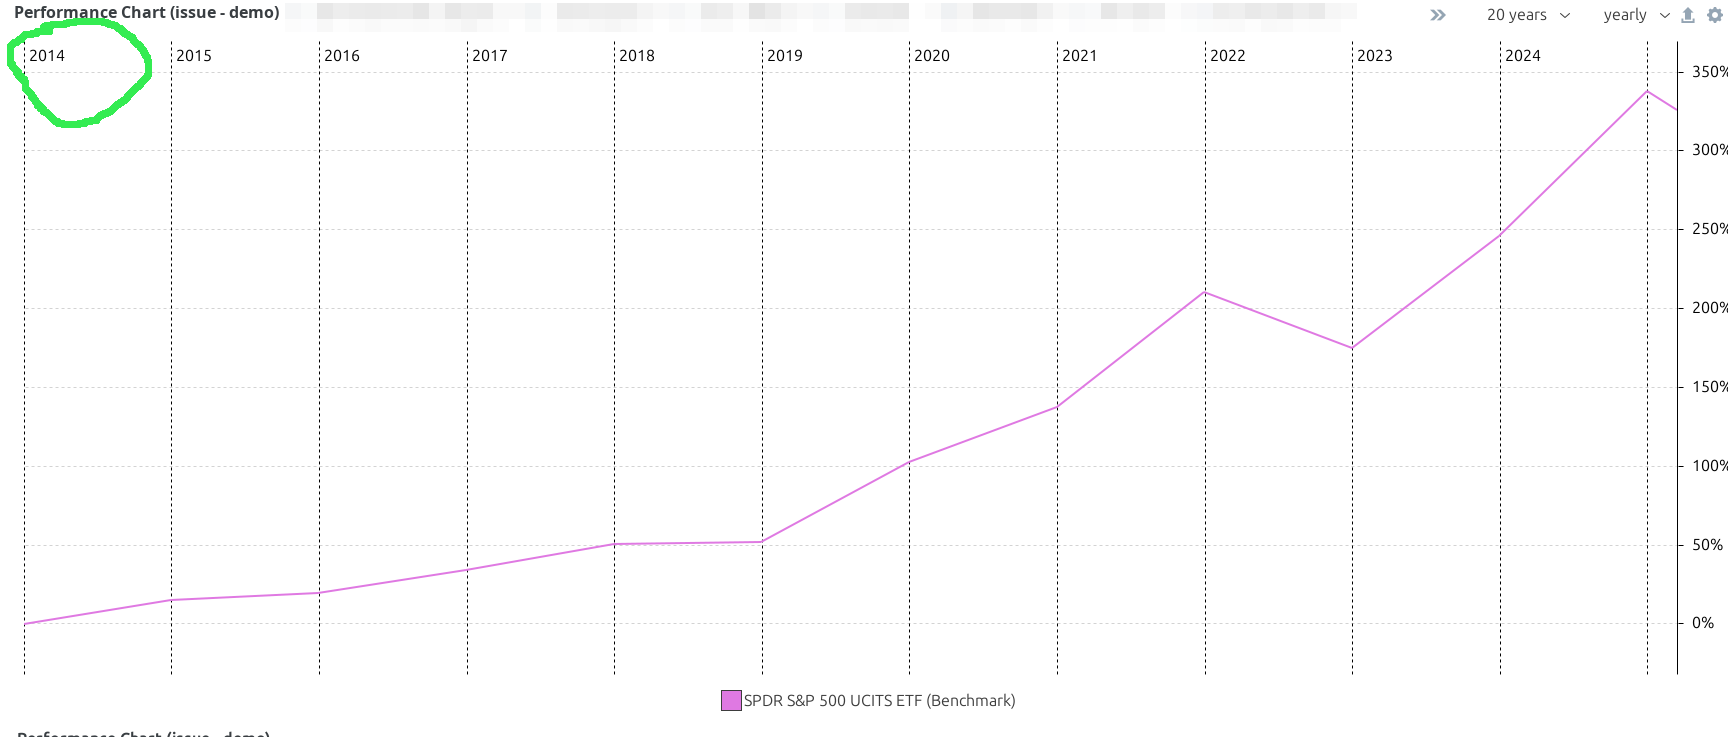
For some reason, the performance chart is limited to show 8 years of past data only though I have 25 years of historical data available. I was using the security as a benchmark.
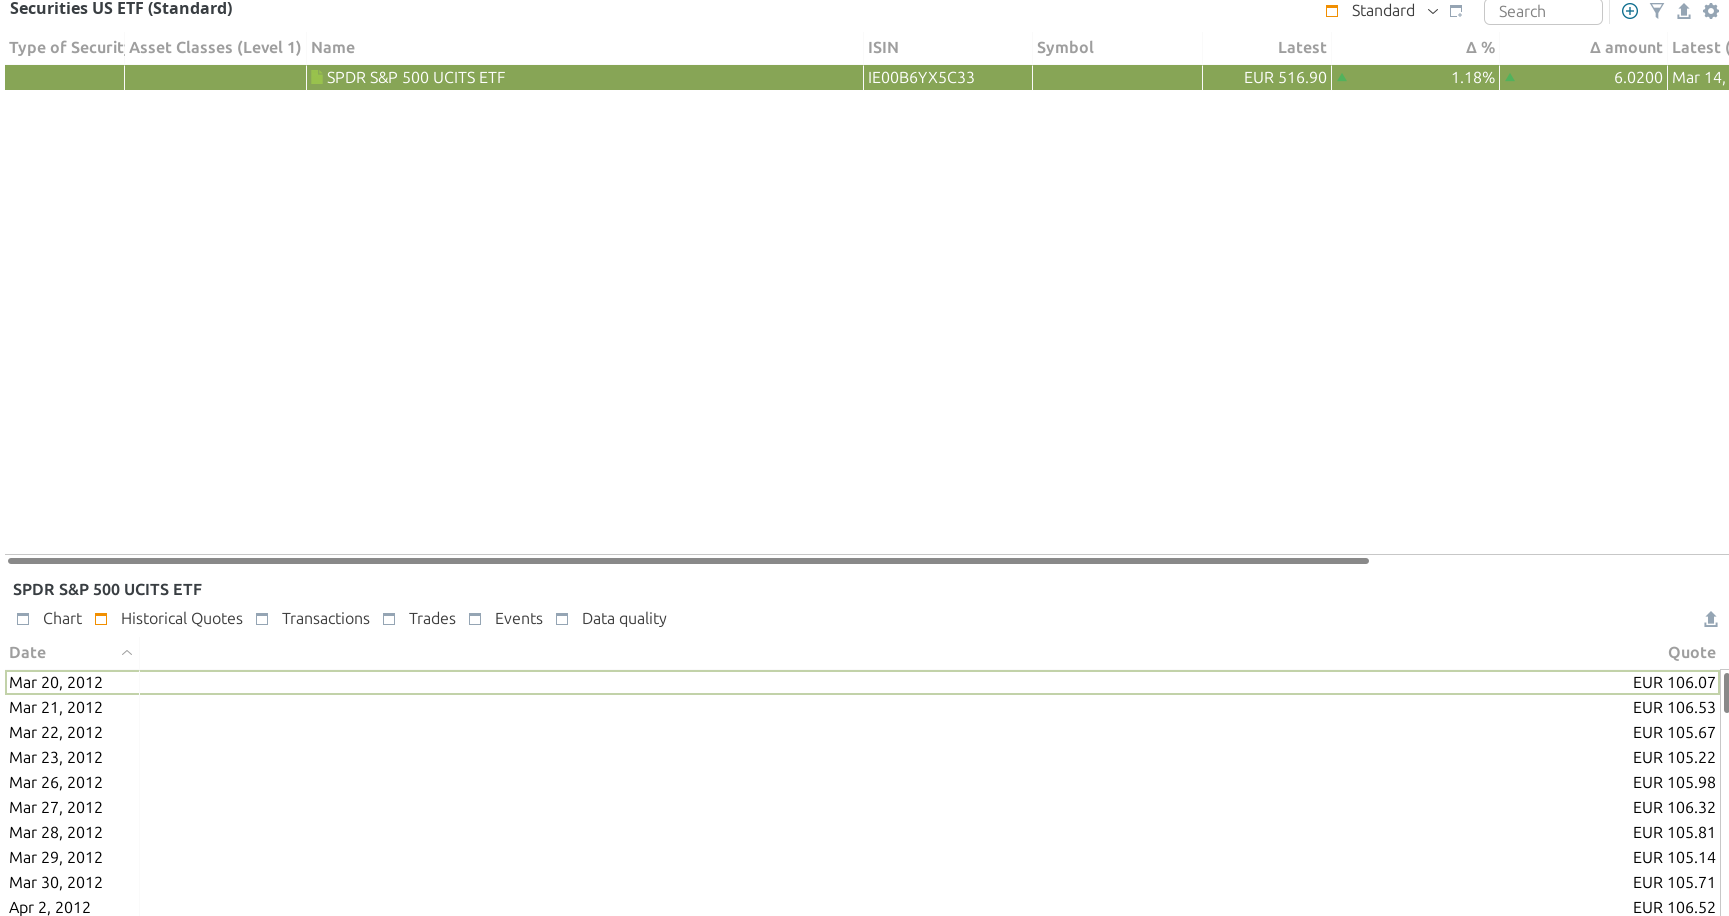
The issue observed only in performance chart. Historical chart provides the data as expected. Through drop down i have selected 10Y, 15Y, 20Y range in performance chart, data remains same.
Could be my setup issue as no one reported here. Any help would be appreciated.
What is the date range conditions at the top right of the performance chart? Screenshots are helpful to see what you’re seeing at your screen. A
Assuming per day could be heavy…