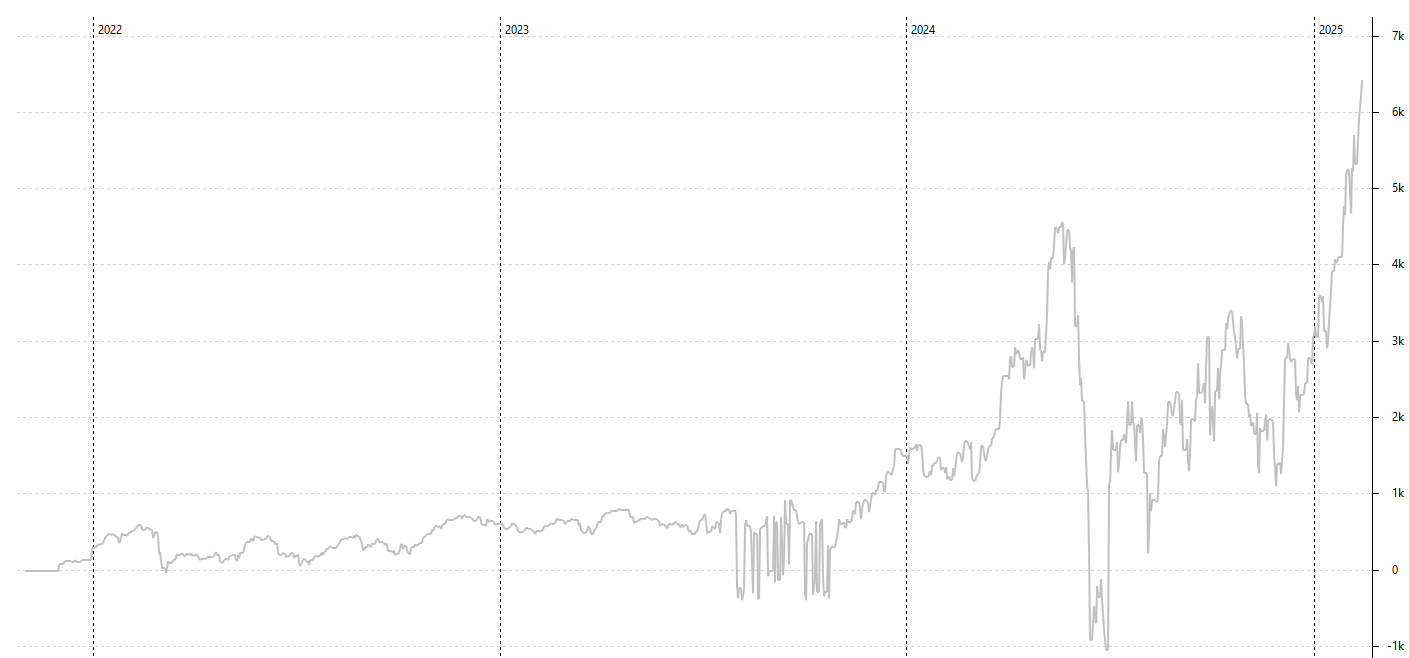
He is implementing each time the amount of money I put on it;
So of course I will have an increase of performance because I inject money.
I would have the same but with the actual benefits like I have on this one but in % and not in value.
I don’t know where is my issue
If it’s work then I will be able to comparate an ETF with my portfolio with the same amount of cash invested to check if I did better of not. Right now, I can’t compare
Hello,
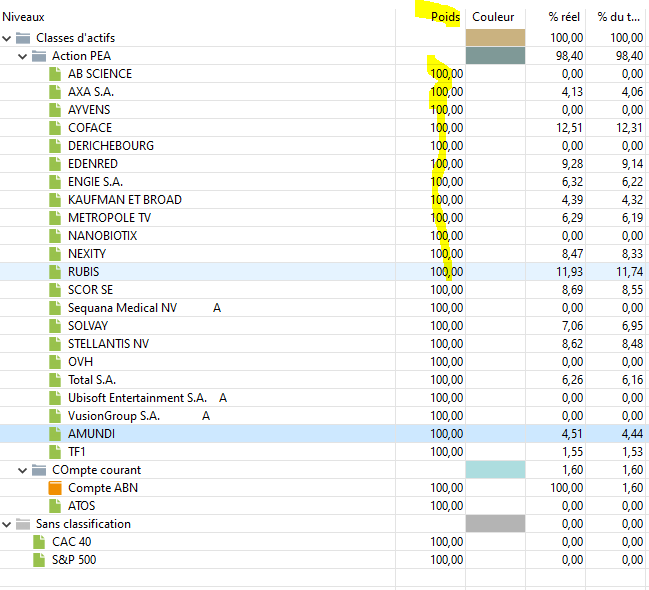
It is normal to have 100% here but you can modify it you need. You can change this number if you want to put a stock /ETF in several categories : if your Taxonomy(=classification) is about sectors or countries, you need to split an ETF world accordingly for exemple. X% US, Y%Europe etc
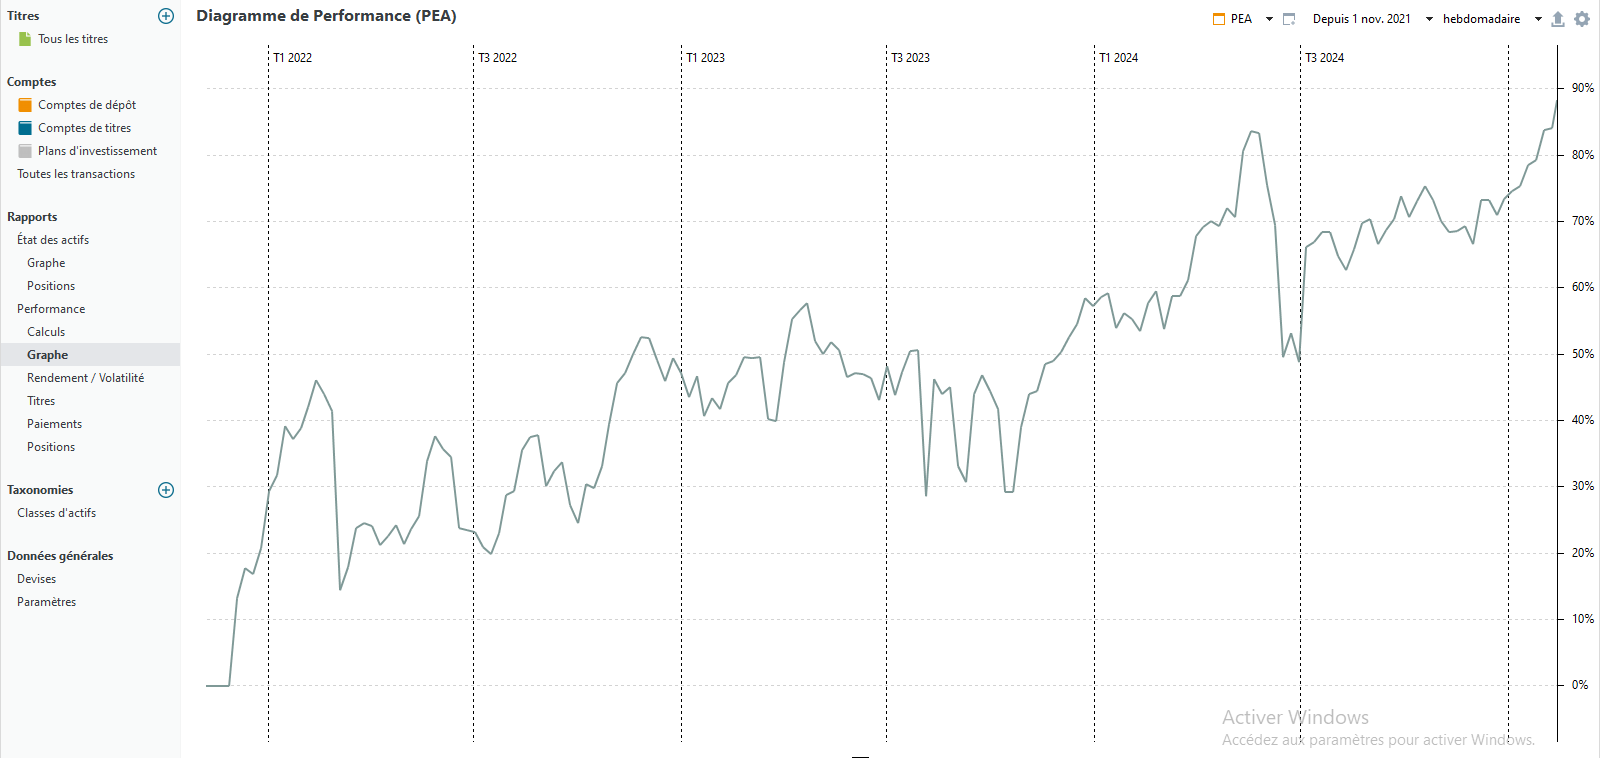
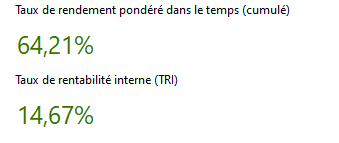
The performance chart shows the TWR and not the IRR.
However, even in the TWR case, injection of money should not impact the TWR. Are you sure this is the case ?
However, even in the TWR case, injection of money should not impact the TWR. Are you sure this is the case
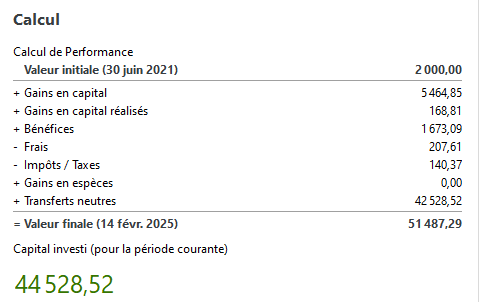
**I guess because my TRI yield global is around 15% (51487-44528)/44528
But with the graph i got 60% at the end which is absurd…
If need I can share my portefolio files and you might be able to see the issue ?
The two indicators TWR and IRR(=TRI in French) can show different values. Sometimes one can even be positive, while the other is negative for the same investment !
TRI is a performance metric which is ‘money-weigthed’ (+5% while you had 10k€ vs +5% while you had 10€ will be considered differently in the final IRR), while TWR is not money-weighted, +5% is +5%, whatever the amount.
This video explains it better and very well :
Maybe something to look into in your case : end of 2023 there seems to be several movements, and the account becomes negative, is that really correct ? Did you buy more then you actually had ?
Plus the IRR is annualized, while TWR on the widget and the graph is not. If the 14.67% IRR value is over a reporting période of several year, then the 14.67% is per year. TWR is not per year but cumulative.
There is a widget for TWR annualized. You can see if it is closer than your IRR this way.
There is an option in PP to show “p. a.” next to annualized values to not forget it.
14/02/2025-30/06/2021=1325 days.
64.21% cumulative over 1325 days is equivalent to an annualized return of :
(1+64.21/100)^(365/1325)=1.6421^(365/1325)=1.1464=1+14.64/100. So 14.64% annualized,close to your IRR.
")