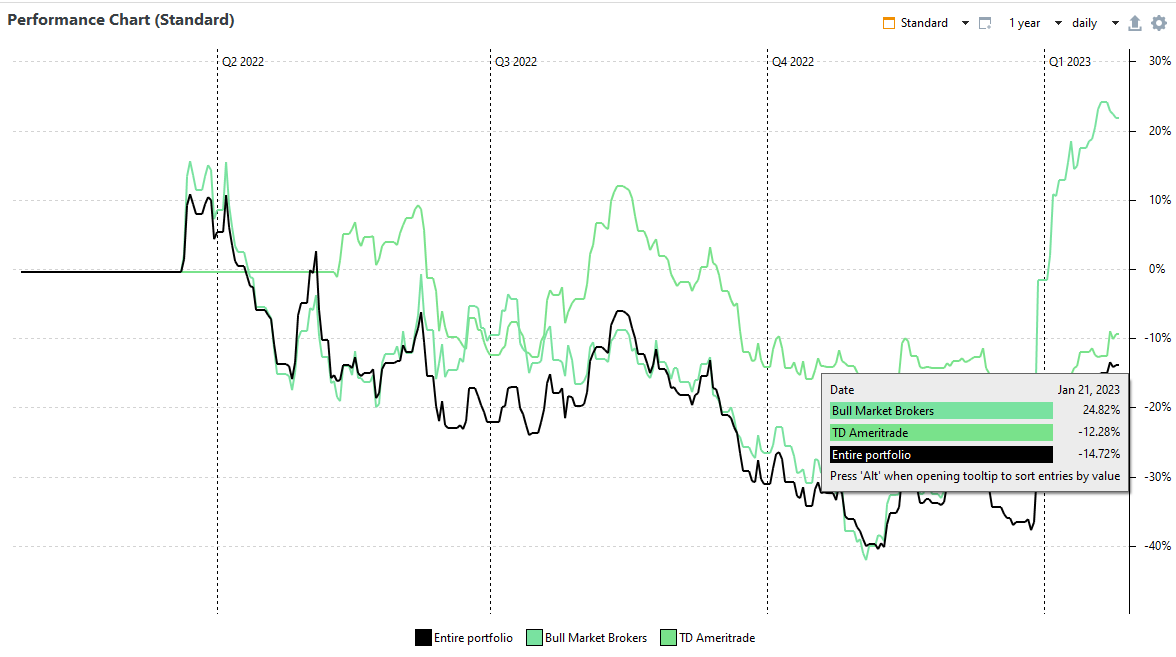
With investment account 1 I did a +24.82% return. With account 2 I did -12.28%. How is it possible that the return of both accounts combined is -14.72%?
Example (adapted from Renditen addieren sich nicht wie erwartet (TTWROR) - #16 by chirlu):
- There are two securities (assume one in each of your accounts), C and S.
- During the first month, C gains +100%, during the second, it falls to –50% (in all, ±0).
- S falls to –50% during the first month and gains +100% during the second (in all, ±0).
- Initially, you invest $100 into C and $50 into S (total $150). After one month, you have $225 (corresponding to +50%) and change your investment to have $50 in C and $175 in S. After the second month, you have $375 (corresponding to +150% as compared to the initial $150).
- Note that +150% is not between ±0 and ±0.
1 Like
You mean the performance of the two funds.
@chirlu I don’t believe your answer which could only really be demonstrated in PP. I’m of the same opinion as @Ale_Irurzun initially implied, the performance of the entire portfolio should be the performance of the amount held of each security as if they were all in one account.
My example is three accounts that have no mixing of funds and are fairly static, so minimal trading effect:
- small account a few years old with say $1,000 which has performed well
- large account say from 2021 Q2 with $100,000 which is under break-even
- large account say from 2021 Q3 with $100,000, no transactions since establishment and well under break-even due to recent tech stock performance
Given account one is insignificant and there have been few movements I know performance for the Entire portfolio is between accounts 2 and 3. PP reports the Entire portfolio performance greater than the better performing of the two larger funds.
Maybe Entire portfolio performance includes dividends and the other accounts don’t.
This is not a matter of opinion. It is a mathematical property of time-weighted returns.
Maybe but my BS detector is very active when I look at the chart. Maybe you can direct me to the appropriate tests and I’ll do the calc myself to verify it. It is something I had intended to do anyway.
I have given you a complete example.
My example was not what is possible but what PP actually calculates. I didn’t see a test (portfolio/name.abuchen.portfolio.tests/src/name/abuchen/portfolio/math at master · buchen/portfolio · GitHub) that confirms calculations match the expected results.
TWR calculations are complex and it is hard to imagine, largely due to the inflows and outflows. I gave an example with minimal inflows and outflows so I thought they could reasonably be ignored allowing the trend for the entire portfolio to be imagined from the other trend lines. I also noted a couple of factors that might affect the values.
Regardless, users should be skeptical. If the calculations are correct it becomes a matter of understanding and usefulness. There are other discussions comparing Time-Weighted Rate of Return and Money-Weighted Rate of Return and whether to include cash sitting in a trading account.