Hi everyone,
I’d like to see the performance of my portfolio excluding one specific security. I only have one securities account (plus one deposit account), so an account filter in Grouped Accounts doesn’t help.
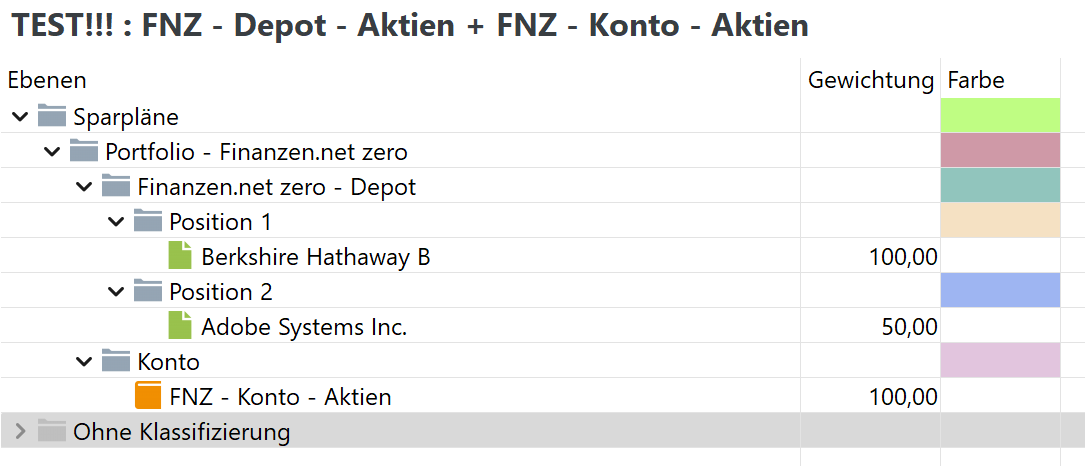
Based on the manual and other forum threads, I created a custom taxonomy with one category and assigned every security to it (100% each), except the one I want to exclude. The idea was to add that category as a data series in Performance > Chart.
The problem: when I click the gear icon > Add data series, the “Pick data series” window shows only these folders: “Common”, “Accounts and portfolios” and “Securities”. There is no “Taxonomies” folder, even after scrolling to the bottom of the list. I have also saved and reopened the file.
Questions:
- Why might taxonomies not appear in the “Pick data series” dialog? Is there a setting or condition I’m missing?
- Is there another recommended way to chart the performance of the whole portfolio excluding one security?
I understand taxonomy data series are always pre-tax, which is fine for my purpose.