A few weeks ago I noticed that the pie chart and donut chart for any taxonomy (or at least “Regions” and “Industries (GCIS)” no longer show up.
The tree map and stacked chart(s) are correctly displayed.
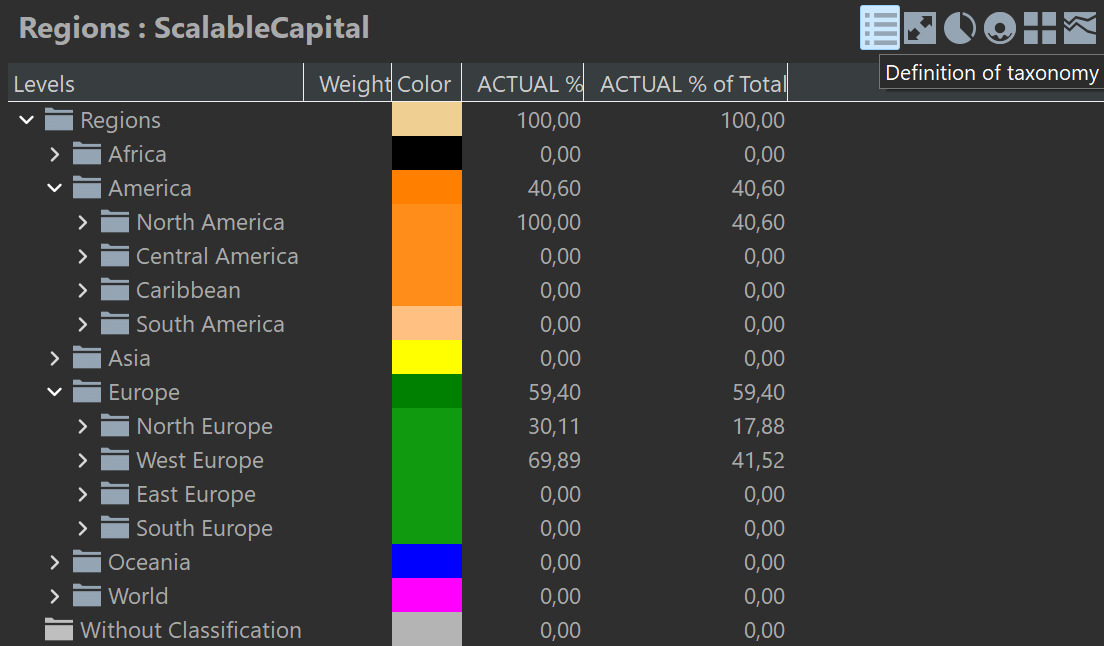
The securities are properly grouped in the “Definition of taxonomy” tab; it used to be completely fine, and I even tried to redo the securities taxonomy from scratch but to no avail.
Am I the only one experiencing this?
Best regards
Any error in the log? Maybe share a screenshot to better understand? On which platform (Windows, macOS, Linux) do you experience the problem?
It’s on windows:
Version: 0.78.0 (August 2025)
Platform: win32, x86_64
Java: 21.0.5+11-LTS, Azul Systems, Inc.
Here is an example with the definition of the Regions taxonomy:
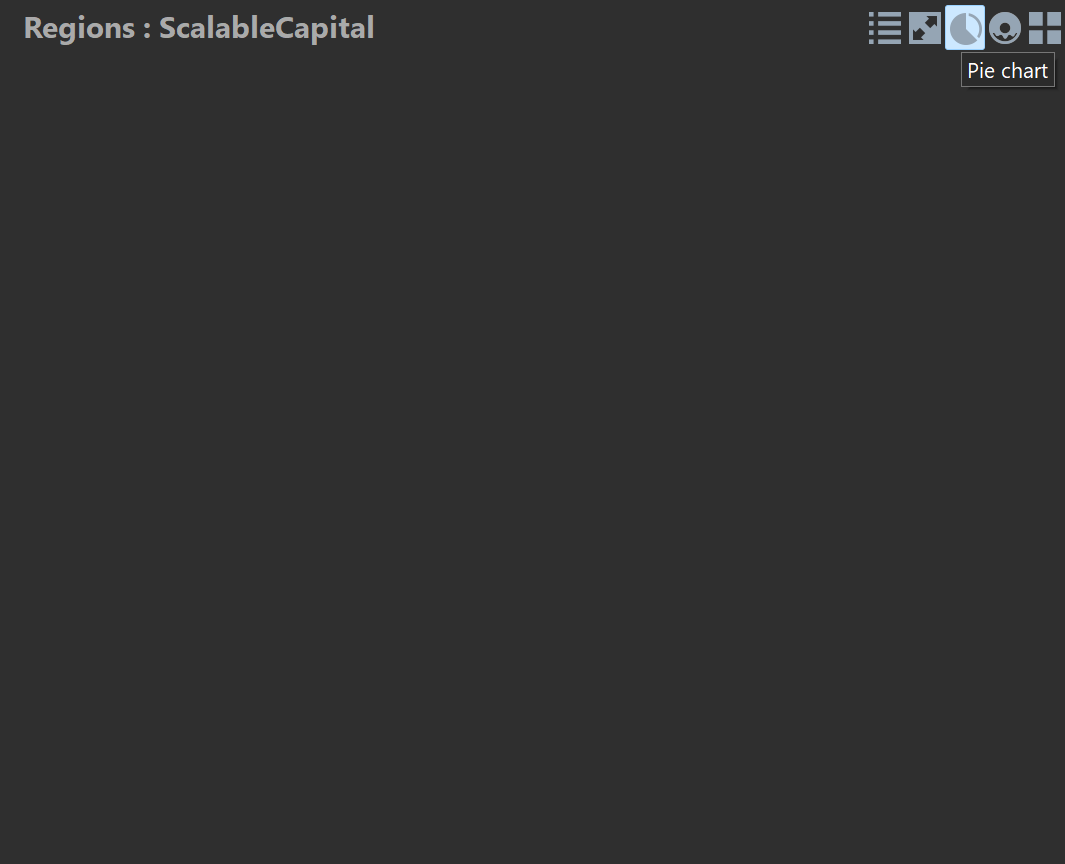
The pie chart tab just stays empty (same for the donut chart):
Stacked area chart looks ok:
No Error Log entry relating to this.
Any further info I could provide?
I appreciated your reply, thanks
What happens if you check “use SWT charts for pie charts”? You find this in the Help → Settings on the first page.
And: does the pie charts for “holdings” work?
1 Like
What happens if you check “use SWT charts for pie charts”?
It happens that you solved the issue, great job 
Pretty sure I never even noticed that option, let alone unchecked the box; maybe it was modified between updates?
And: does the pie charts for “holdings” work?
Now it does too, but before ticking that box it didn’t work either.
Many thanks!
no, no. There are two implementation of the pie charts. One - the nicer option - relies on the embedded browser. This options does not seem to work anymore on your computer.
For me to do troubleshooting, can you
- save the full log (Help → Save error log) and
- the installation details (Help → About Portfolio Performance → Installation details)
and send them to portfolio dot performance dot help at gmail dot com?
I want to understand if newer Windows version create a problem here.
Now I better understand the point.
For example, with the currently working but “less nice” pie chart option I can no longer navigate the chart sectors by left- and right-clicking on them.
Also, yes, I do have a newer Windows version now.
Just e-mailed you the logs you requested.
Thank you!
1 Like