I have a workplace pension with very limited data. I know the amounts and dates of my monthly contributions, and I know the overall valuation at 3 month intervals. How do I track overall performance?
I tried creating an empty investment and deposit account, added all my contributions to the deposit, and then bought 1 nominal share in the investment at the price of that months contribution. However, this doesnt seem to work correctly, presumably because no where am I recording the overall valuation.
Bit lost as to how to go about this?
sample data
| Date |
Contribution |
overall valuation |
% change I want to see reflected in chart |
| 1/1/2024 |
100 |
|
|
| 1/2/2024 |
100 |
|
|
| 1/3/2024 |
105 |
|
|
| 5/3/2024 |
|
310 |
1.63 |
| 1/4/2024 |
105 |
|
|
|
|
|
|
|
|
|
|
Hi, you have to feed this empty security with manual price per share. You can do a right click on this security and in this context menue should be an option to add a manual price.
OK, thanks, can see that. so, do I buy 1 share at £100 and £105 for those first 3 months, then add a quote of 100.0163 on the 5/3/2024? If so what do I do on the 1/4/2024? doing this isnt the valuation going to fluctuate incorrectly?
Or, should I be buying 100 shares at £1 at the start and doing it that way, if it makes a difference.
Sorry, still confused!
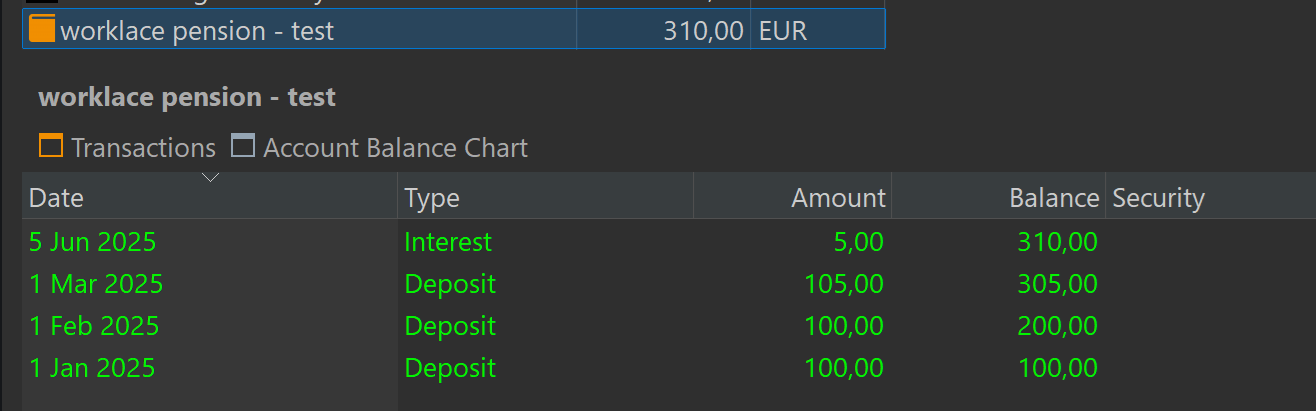
Ok, with this limited amount of information from the worklace pension, I think it`s not the best way using a dummy security. How about just using a separate deposit account for this worplace pension?
1/1/2024 - Deoposit of £100
1/3/2024 - Deoposit of £100
1/3/2024 - Deoposit of £105
5/3/2024 - Intest of £5
= total £310
In Performance Dashboard you can add new widgets for TTWROR and/or IRR and as data series you can select just this deposit account for your workplace pension.
Is this a solution?
Nice idea, but I only get an account balance on the chart, with no distinction between what I paid in and the growth. I was hoping for something that showed the delta between invested amount and overall value either as an amount or a percentage.
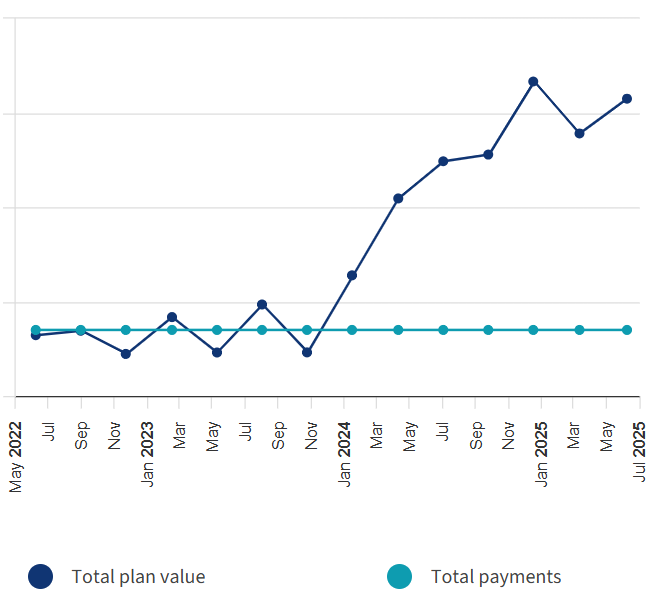
Ideally I want to replicate this kind of view:
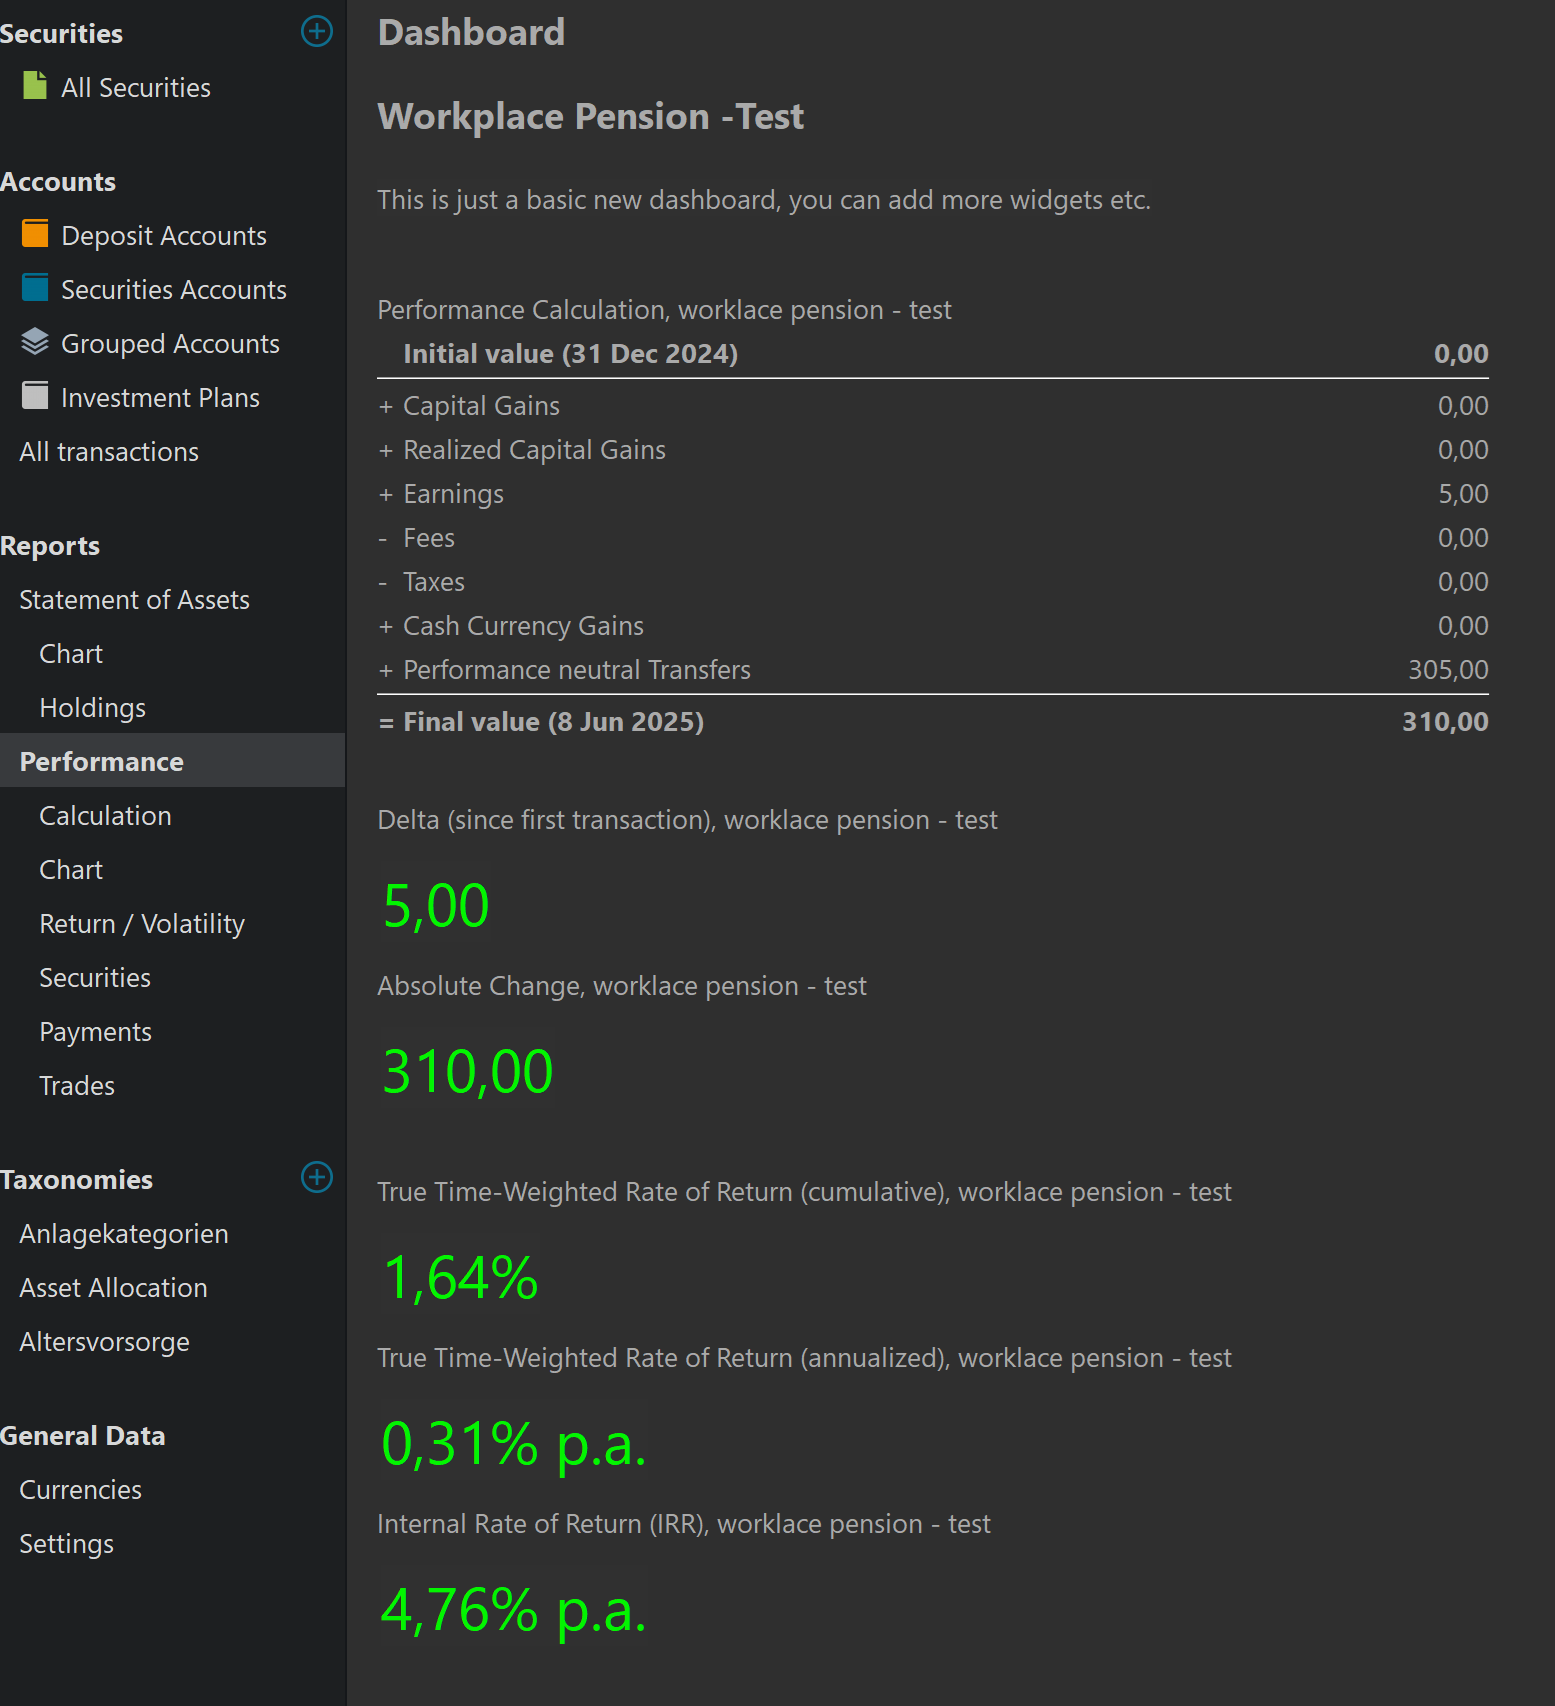
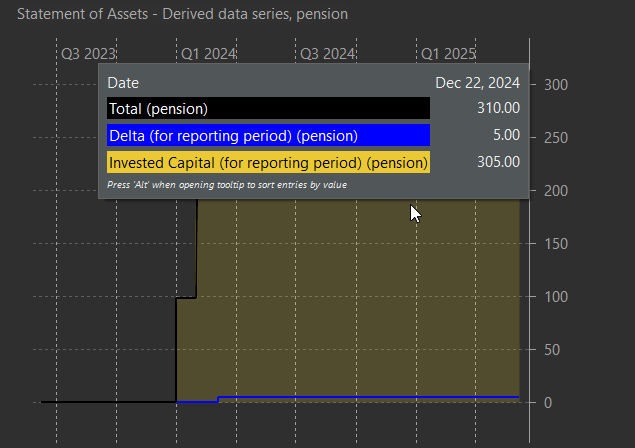
You can build a separate dashboard just for this deposit account and add widgets for delta and overall value:
This was my test input:
many thanks for taking the time to demonstrate this, really helpful. It sounds like this is probably the best I can do with the limited data, and it does reflect the true picture. Maybe I just have to accept I cant get a pretty graph!
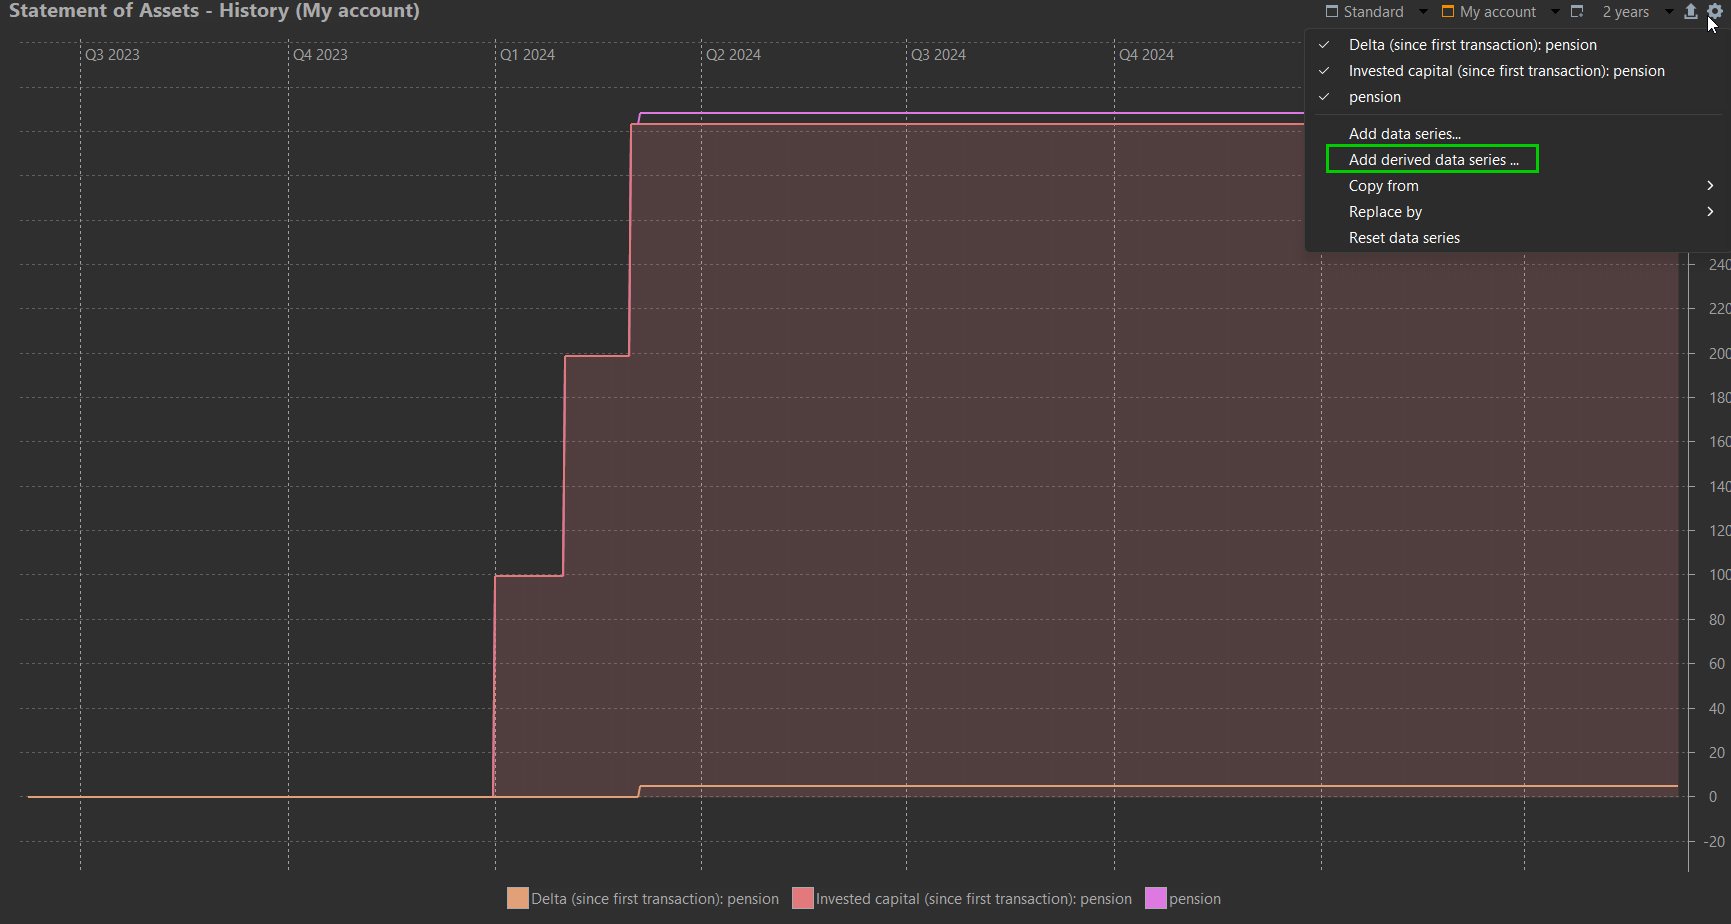
You can, what you want seems to be Delta, Invested Capital and Valuation of this account. They can be plotted at three locations :
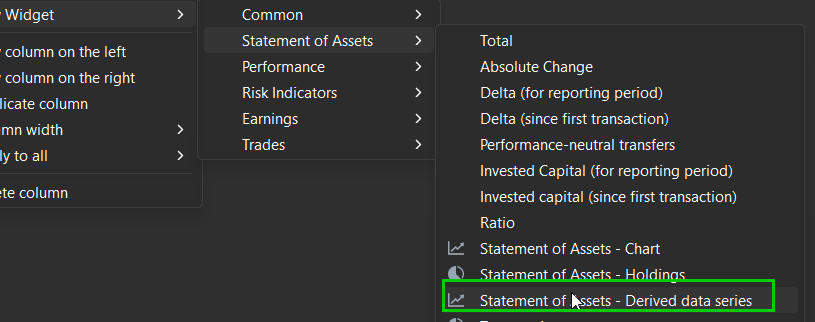
- Statement of Assets / Chart : in the “add derived data..” you can add Delta dedicated to this account, Invested Capital dedicated to this account. For the total value of the account, it is in “add series…”
- In the Performance Dashboard, you can add a widget called “Statement of Asserts -Derived Data serie” and apply it to your account
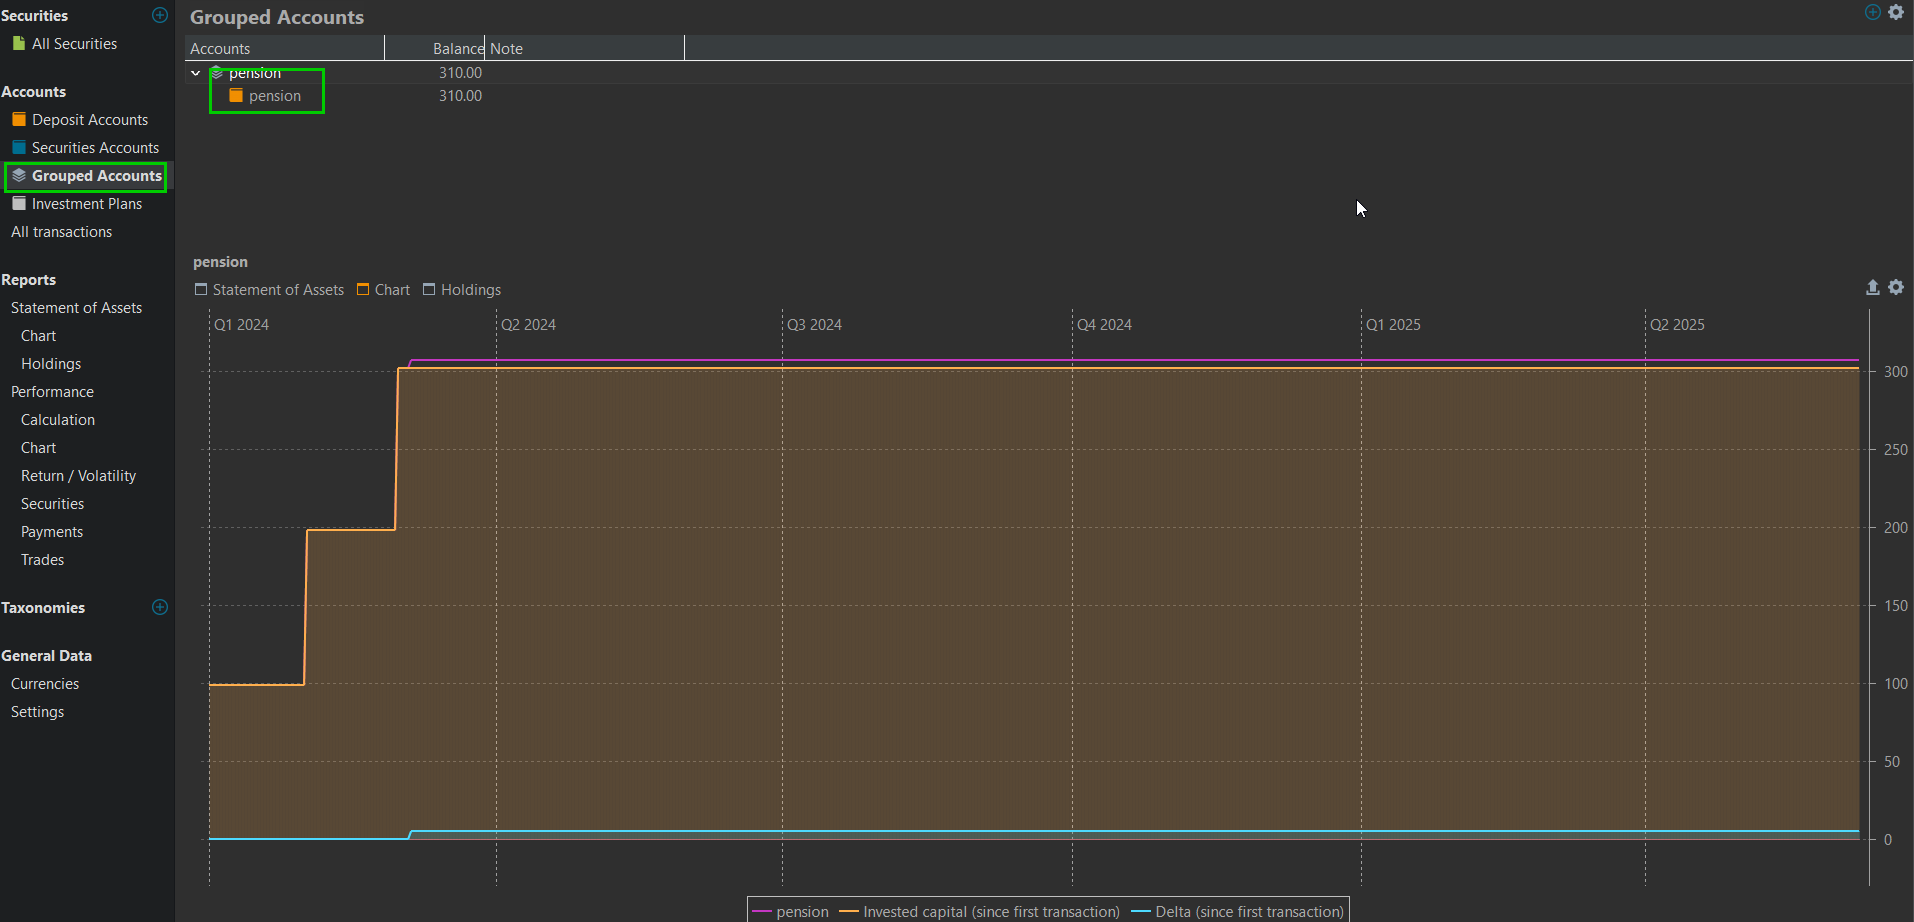
- You can create a Grouped Account composed only of your deposit account, it will create a Chart tab with the delta and invested capital.