I’m having a bit of trouble understanding the performance chart in PP. From what I’ve read, it’s a cumulative return since the start of the period under consideration.
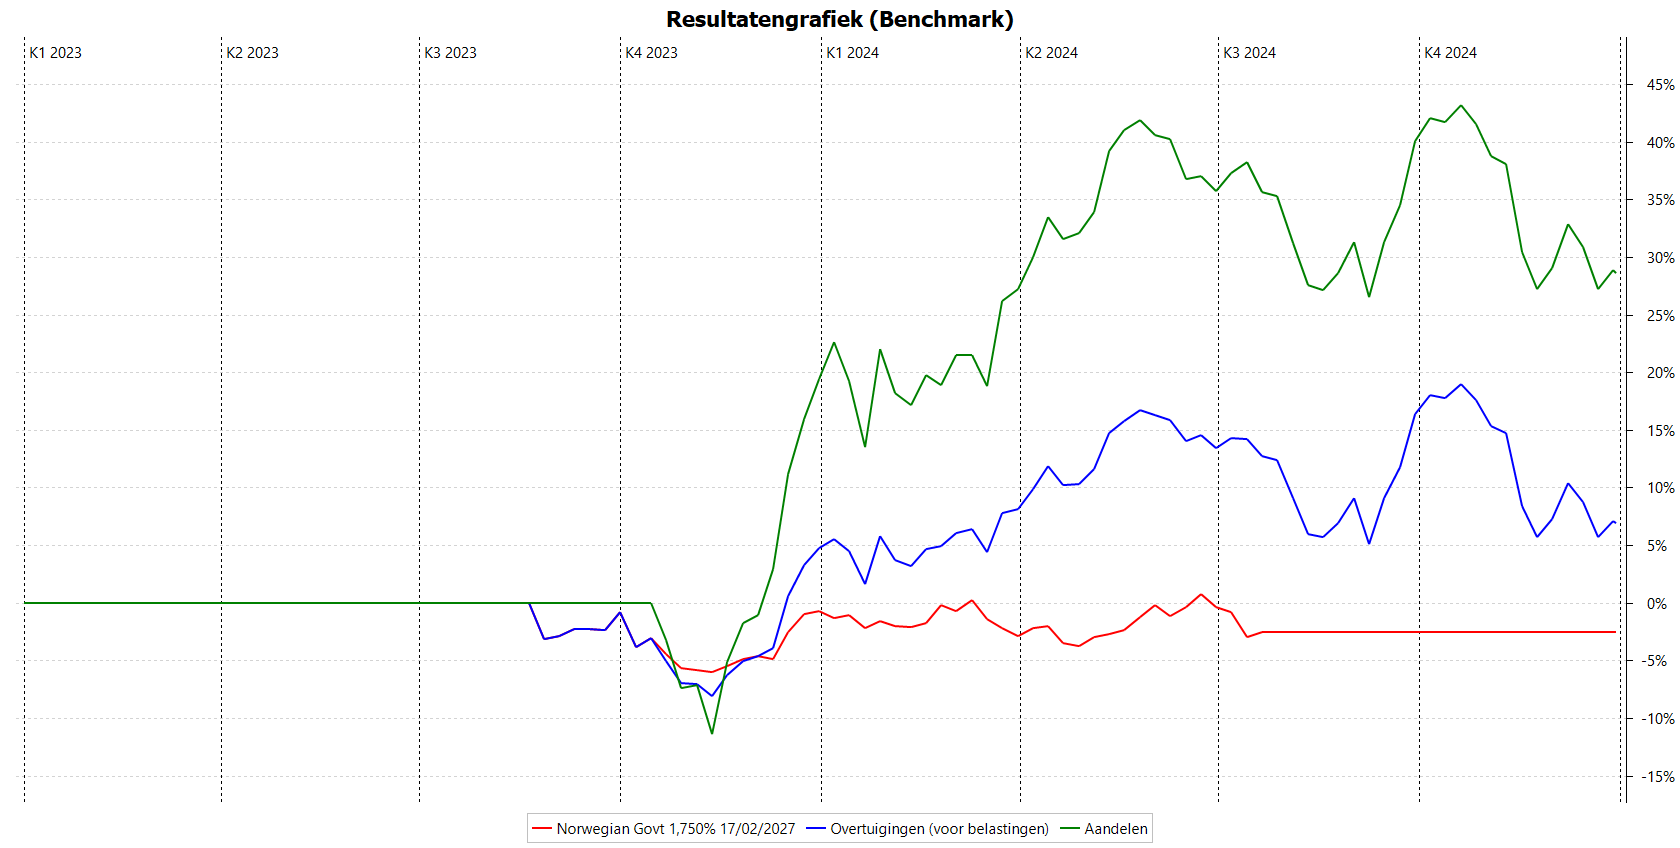
However, the attached graph shows a surprising result: in blue, the performance of my entire portfolio, made up of individual equities (green curve) and a single bond (red curve), held between August 2023 and July 2024. The performance of this bond - although its price has risen between the time of purchase and sale - is negative (security TTWRoR of -2.54%) because of the many fees. Note that the bond represented around 20% of the portfolio.
Is it normal that there is still a huge gap between the portfolio with and without this bond (blue and green curves respectively) at present?
it is hard to judge without seeing the rest of the story.
Does the entire portfolio contains cache? so that the green curve actually represents a smaller sum that the sum of the single bond? This way bigger changes in the green curve do not effect the overall performance as heavily as the red curve.
@chirlu So if I understand correctly, the blue curve (whole portfolio) will never converge towards the green curve (equities only), unless I put bonds back in my portfolio which perform better than my equities. In other words, holding this one bond for a short period of time definitely reduces my overall return. Is this correct?
@Harry_Hirsch There is no cash involved in these charts.
Finally, does the calculation of this cumulative return take into account the weight of each asset? Or doesn’t it matter that there are 80% in equities and only 20% in bonds (which fluctuate much less)?
Hey dyene,
image you hold 1000 EUR in stocks which went to 1800 EUR. This is a performance of 80 % (steep green graph). Ate the same time you did have 100.000 EUR in a bond. This had a performance of 10 % (flat red graph), i. e. went to 110.000 EUR.
The overall performance is from 101.000 EUR to 118.00 EUR, equals to 17 % (blue graph) … you see not nearly close to the green graph.
You also see from that that converging is not a funtion of time but a function of the ratios of the securities.
Yes. You start off, at the time of the bond sale, from a lower amount of money than you would have done otherwise (e.g., 9000 instead of 10000). Now, whether you double or triple your money, the gap isn’t going to close. In absolute terms, it is even going to grow (27000 vs. 30000, so 3000 difference instead of the original 1000).
Of course, you are free to change the reporting period and look at the development since September, say. Then you start afresh at 0%.