Is it possible to perform portfolio analysis in Portfolio Performance using monthly data instead of daily data?
I ask because, as on Portfolio Visualizer, in my estimates using monthly data results in more consistent and reliable calculations of Max Drawdown and Volatility, especially for long-term evaluation.
If there is a way to carry out this analysis in Portfolio Performance, could you please provide the steps to do so?
The reason I prefer using monthly data is that daily data introduce a lot of noise and inconsistent fluctuations in the analysis. For example, considering an ETF replicating the MSCI World, daily data show a volatility above 40% over the last 5 years, while monthly data indicate around 17%, a value more consistent with the index’s long-term trend. The same applies to the maximum drawdown.
In my opinion, when evaluating a long-term investment, excessively high values appearing in short periods can distort the analysis and provide less reliable insights. Therefore, using monthly data helps to obtain a cleaner and more stable view, useful for long-term decision-making.
This choice reduces market “noise” and makes the analysis more robust for long-term strateg
I see Fabio’s point, in my case for example: several securities (open-end funds) have monthly nav only (hence monthly quotes only), and would be very helpful to see their correct volatility, calculated on a monthly basis.
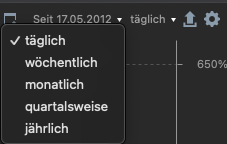
I know that Performance Chart can be set to Monthly, but that is not the case for the Return/Volatility Chart. Any chance to see that detail elsewhere or that can implemented in future versions?