Hi,
Question regarding PP and its calculation regarding Cost Average per share.
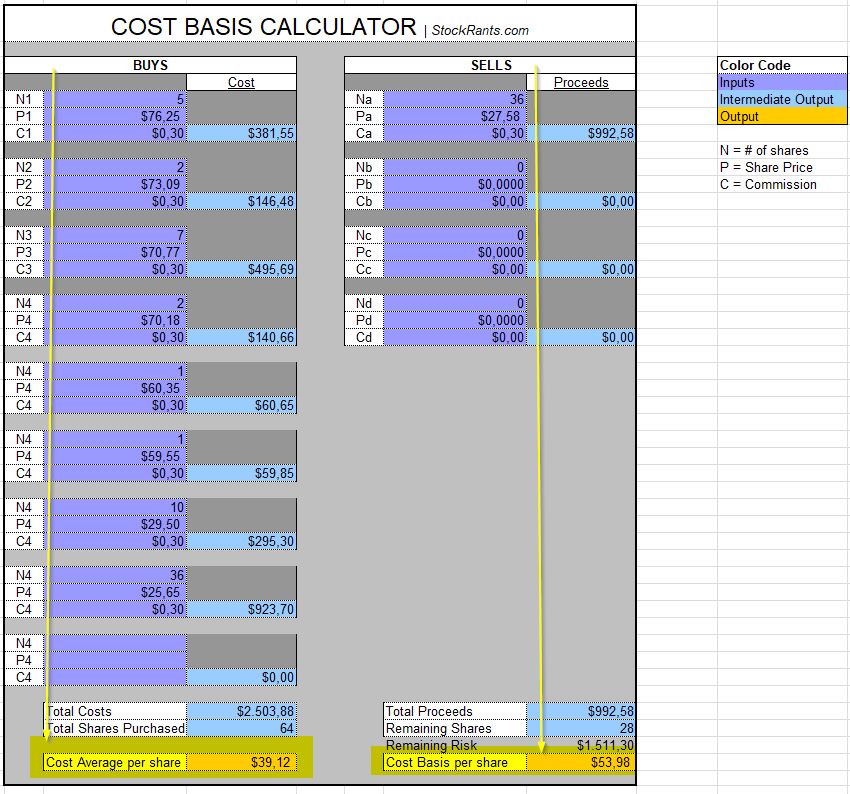
From what I’ve seen it looks like PP only looks at „buys“ and calculates the avg price based on those but PP does not seem to look at the average price if you’ve sold shares along the way which by not doing this can really give a wrong image of reality.
Yes but I don’t get the point
Let me put it another way, My question is: Does PP give you the average price of your shares when you bought and sold shares or does it only account for the buying of shares?
Reason of asking is because I showed that using the Excel sheet above it looks like PP only looks at the buying of shares and not keeping score of selling to determine the avg. price?
@chrilu I’m looking at the Security Performance Standard.
Can you tell me what other views are available that show different numbers. I need to know if I’m under water on a position by gauging the average shareprice.
@Ragas In the example the price is show to be 8.23 (4525/550 shares)
Lets say I sold 200 shares for 8 , what is now my average shareprice?
Hmm @chirlu not really.
What I’m looking for simply is I want to see if I’m up or down on a position where I’ve bought and sold shares in the past.
If I know my average shareprice after buying and selling shares in the past, I just have to look at the current price to know if I’m up or down
In my opinion, the average share price should not change depending on the sale.
If you sell, it does not influence how much you spent to buy the shares in the past, you are just reducing the number of shares you currently have. It does not change the amount originally invested in the shares you currently have. Once the shares are sold, they should not influence the value of your investment.
Still 8,23 but for 350 shares.
edit for clarification:
you start with 550 shares each worth 8.23, for a total value of 4.526,5
you sell 200 at 8, which means you receive 1.600 from the sale, but lose 46 because you sell each of them 0.23 below your average price (therefore 200*0.23).
Now your asset value is 4.526,5 - 1.600 - 46 for 350 shares. Guess how much is the new average price?
As far as I can see, none of the performance tabs gives the same result as the banks and tax authorities here in Denmark for stocks that have Sell transactions. Banks and tax authorities use the weighted average method and when you sell a stock it’s calculated at the weighted average quote value.