Sharpe ratio widget mixes an annualized return with a period-scaled volatility

Hi,

The Sharpe ratio dashboard widget currently combines two different time conventions in the same fraction. I think this is worth discussing separately from the existing threads on annualized volatility (issue #5842, and the older Rendite / Volatilität Grafik), because it is not a matter of display preference.

The mismatch

Risk.Volatility computes sqrt(sum/(count-1) * count) — the daily standard deviation multiplied by the square root of the number of trading days retained in the reporting period. The volatility is therefore scaled to the length of the reporting period, and coincides with the conventional annualized figure only when that period is about one year. This is by design; AndreasB explained exactly this in the 2017 thread linked above.

The Sharpe ratio widget then computes (IRR - risk-free rate) / volatility, where:

  • getPerformanceIRR() is a per-annum rate — NPVFunction discounts with days / 365.0;
  • the configured risk-free rate is a per-annum rate;
  • the volatility is not annualized.

The numerator is annualized, the denominator is not. They only cancel out when the reporting period happens to be one year.

Two examples from the same portfolio, on the same day

Same file, same data, same configured risk-free rate of 4.00%. Only the reporting period differs.

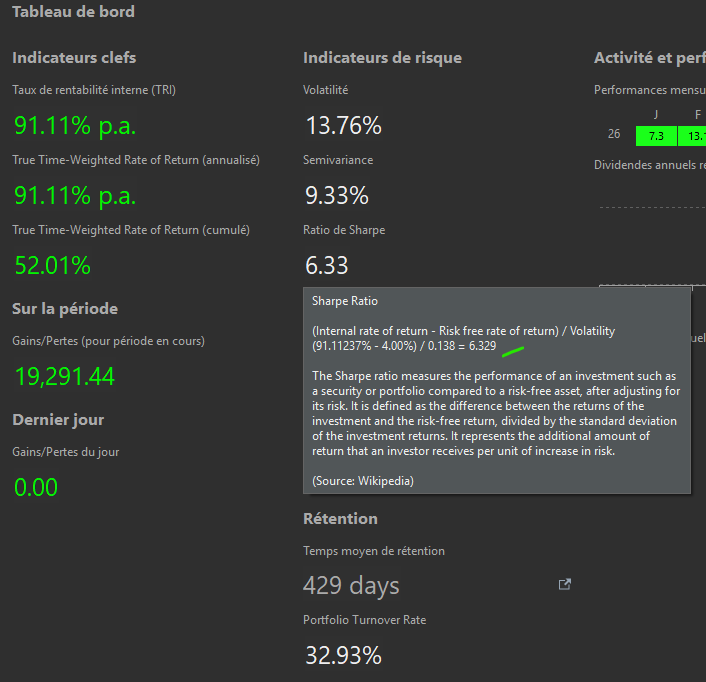
Year to date
(31 Dec 2025 → 24 Aug 2026, 236 days)
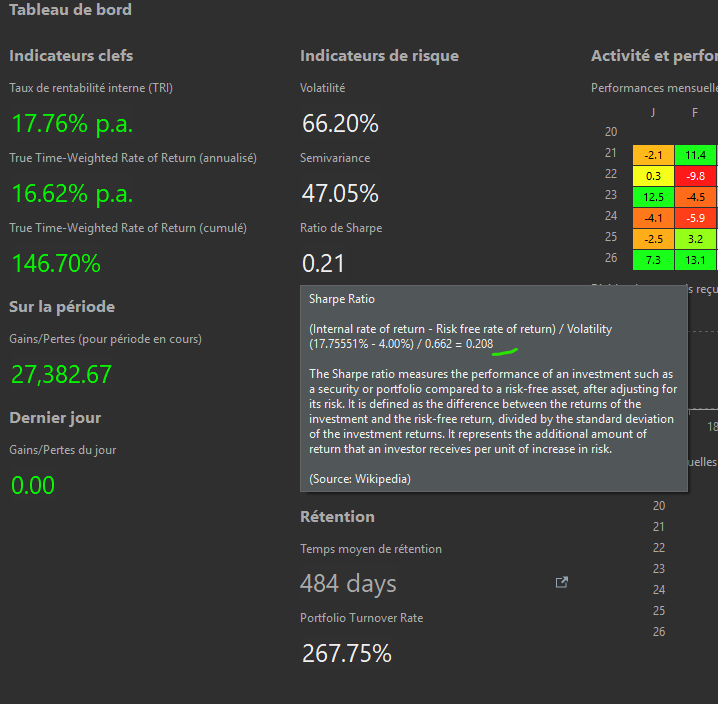
Since inception
(10 Oct 2020 → 24 Aug 2026, 2144 days)
IRR 91.11% p.a. 17.76% p.a.
TTWROR 52.01% cumulative / 91.11% p.a. 146.70% cumulative / 16.62% p.a.
Volatility widget 13.76% 66.20%
Volatility, annualized 17.11% 27.31%
Sharpe ratio widget 6.33 0.21
Sharpe, annualized/annualized 5.09 0.50
Sharpe, period/period 3.59 1.82

The tooltips confirm the inputs: (91.11237% - 4.00%) / 0.138 = 6.329 and (17.75551% - 4.00%) / 0.662 = 0.208.

Year to date:
Since inception:
Three observations:

The distortion changes direction with the window. Over eight months the ratio is inflated; over 5.9 years it is understated by more than half. Only the denominator grows with the length of the period, so a short window flatters and a long window penalises.

Most of the apparent gap between the two windows is an artifact. A user reading this dashboard sees 6.33 versus 0.21 — a factor of 30. Under a consistent convention it would be 5.09 versus 0.50, a factor of 10. Two thirds of the difference comes from the length of the reporting period, not from the portfolio. This is precisely what makes it impossible to track a portfolio’s risk-adjusted performance over time, or to place a short-window and a long-window widget side by side on the same dashboard.

The volatility figure itself is hard to interpret. 66.20% for a diversified multi-asset portfolio looks like a leveraged fund; the annualized figure is 27.31%, which is unremarkable for an equity-heavy portfolio. The widget is simply labelled “Volatility”, and nothing in the label or the tooltip signals that this number is not on the same scale as the figures published in fund fact sheets.

There are only two internally consistent ways to build the Sharpe ratio — annualize both terms, or annualize neither. Both are defensible: the first is what fact sheets publish, the second makes no extrapolation and simply describes what happened during the window. The value currently displayed is neither.

Proposal

Add an EnumBasedConfig with Policy.EXACTLY_ONE to the widget context menu — Period / Annualized — following the existing CostMethodConfig pattern, on the Volatility, Semideviation and Sharpe ratio widgets.

For the Sharpe ratio the setting would apply to the whole fraction, not to a single term: Annualized annualizes the volatility, Period de-annualizes the return and the risk-free rate. The ratio is then consistent by construction under either choice, and the user picks the question they want answered.

Two remarks on scope:

  • For Volatility and Semideviation this is purely additive: current behaviour remains the default and existing dashboards are unaffected.
  • For the Sharpe ratio it is unavoidably a behaviour change, because today’s value is in neither convention. Whichever default is chosen, existing dashboards will show a different number. That is your call to make, and the main reason I am asking before writing any code.

Issue #5842 proposes a separate ANNUALIZED_VOLATILITY widget instead, mirroring the TTWROR / TTWROR_ANNUALIZED precedent. I am happy with either approach for the volatility itself — but a separate widget does not address the Sharpe ratio, which needs its two terms on a common scale regardless.

A secondary question

When annualizing, the reference duration can be the reporting period or the time the portfolio actually held assets. For a whole-portfolio series held continuously the two coincide — in both examples above the portfolio is invested throughout — so this is an edge case. It matters when the data series is a single security or a benchmark: a three-year window on a position bought six months ago would spread six months of fluctuation over three years and understate the risk.

There is precedent on both sides in the code base: getFinalAccumulatedAnnualizedPercentage() annualizes over getActualInterval(), while PerformanceHeatmapWidget deliberately uses getFirstHoldingInterval() to avoid exactly this distortion. I would default to whatever the IRR uses, so that numerator and denominator stay consistent, unless you prefer otherwise.

I am happy to implement this, tests and label translations included, once the direction is clear.

Thanks for the great work on this application.

A quick follow-up, since the volatility side of this is already being worked on and it would be a shame for the two discussions to drift apart:

  • Issue #5842 proposes an annualized volatility widget, with the same analysis of Risk.Volatility as above.
  • PR #5846 by Konilo is already open and awaiting review. It adds a “Volatility (annualized)” widget alongside the existing one, backed by a new getAnnualizedStandardDeviation() method on Risk.Volatility. The discussion there also covers extending the same choice to the Return/Volatility scatter plot.

I have no objection to that approach for the volatility itself — a separate widget mirrors TTWROR / TTWROR (annualized) cleanly and leaves existing dashboards untouched.

What it does not cover is the Sharpe ratio, which is the point of this thread. A sibling volatility widget leaves the existing ratio exactly as it is, and the ratio is where the two time scales actually collide. Whatever is decided for the volatility, (annualized return - annual risk-free rate) / period-scaled volatility remains inconsistent, and no separate widget can fix that.

One convention question also seems worth settling once rather than twice: #5846 annualizes with sqrt(252) trading days, while the IRR uses act/365 calendar days. That difference is immaterial for a standalone volatility figure, but for the Sharpe ratio it would be cleaner if the numerator and the denominator shared the same basis.

Follow-up: I have opened PR #5970 on GitHub with a concrete proposal for the Sharpe ratio.

It adds a “Time basis” option to the widget, Annualized / Reporting period, applied to the whole fraction: in Reporting period mode the return and the risk-free rate are converted down to the period rather than the volatility being scaled up, so numerator and denominator always share a scale. Annualization uses the same act/365 basis as the internal rate of return.

It is deliberately scoped to the Sharpe ratio and leaves the Volatility and Semideviation widgets untouched, so it does not overlap with the annualized volatility PR discussed in issue #5842.

The default is Annualized, on the grounds that it changes only the denominator relative to what is displayed today, whereas Reporting period changes the numerator as well. For a one-year reporting period nothing changes at all. If the other default is preferred, it is a one-line change.

Full build is green with three tests added, including the anchor case: for a reporting period of exactly 365 days the annualized volatility is identical to the value shown today.

One thing worth pushing further: whether the period-scaled volatility is a meaningful quantity at all, rather than merely an unconventional one.

There is an interpretation under which it is perfectly well defined. sigma_daily * sqrt(N) is the standard deviation of the cumulated log return over the window, i.e. the dispersion of the terminal value after N days. That is a legitimate question to ask, and it is the natural quantity in an option-pricing context, where sigma*sqrt(T) shows up for exactly that reason. So the number is not meaningless.

It just doesn’t survive contact with what is displayed next to it.

First, that interpretation only pairs with a log return. mu*T and sigma*sqrt(T) are the two parameters of one and the same distribution over the period, which is what makes their ratio mean something. What PP displays alongside is the simple cumulative TTWROR, which is not that mu*T. The two figures sitting side by side are not parameters of a common object, so the pairing has no interpretation even before the Sharpe ratio is formed.

Second — and this is where I would qualify the “annualize neither” branch of your proposal — period/period is consistent in units but still not scale-free. The numerator grows roughly with T, the denominator with sqrt(T), so the ratio grows with sqrt(T). Mechanically, a longer window inflates a period/period Sharpe even for an unchanged portfolio. In your table that effect is masked because the two windows had very different underlying performance, but it is there. So “annualize neither” answers “what happened during this window” honestly, while two such numbers still cannot be placed next to each other. Only annualized/annualized is invariant to the window. I think that asymmetry is worth stating explicitly rather than presenting the two conventions as equally defensible — they are equally consistent, but only one of them is comparable.

A caveat in the other direction, for completeness: any sqrt scaling assumes serially independent returns, which volatility clustering and mean reversion violate. That is the accepted convention and I wouldn’t argue against it — but it is the same assumption in both directions, so it is not an argument for keeping period scaling either.

On scope, I’d add the Rendite/Volatilität chart to the picture, where the same defect arguably bites harder than in a widget. That view exists to be read as a ratio: the slope from the origin to a point is a Sharpe-like quantity. With the y-axis growing as T and the x-axis as sqrt(T), the whole cloud deforms when the reporting period changes, so the same portfolio genuinely looks different depending on the window — and a widget showing a single number is at least a number the user can rescale mentally, while a slope is not.

To be fair on that point: within one chart, annualizing does not reorder anything. All series share the window, so it is a monotone transform on one axis and a uniform rescale on the other. The gain is that slopes become interpretable and that the x-values become comparable to published figures, not a different verdict on which series did better.

You have convinced me on the main point, and the PR has changed as a result: the Annualized / Reporting period option is gone and it now produces a single annualized figure. Taking your points in turn.

On sigma_daily * sqrt(N) being a real quantity. Granted, and I was sloppy to imply otherwise. It is the dispersion of the cumulated log return over the window, which is a legitimate thing to ask about. I should have conceded that before arguing against it.

On the pairing. This one I had missed. Risk.Volatility does compute on Math.log(1 + returns[ii]), so the denominator is a log-return dispersion while what sits beside it is the simple cumulative TTWROR. On my own file the gap is not academic: over the full window the cumulative return is 146.70%, whose log is 90.31%. A period/period ratio built the way I had it gives 1.83; built consistently in logs it gives 1.02.

On scale-freeness. This is what I got wrong rather than merely understated. I had presented “annualize both” and “annualize neither” as two equally defensible conventions. They are equally consistent, but only one is invariant to the window: numerator in T, denominator in sqrt(T), ratio in sqrt(T). The period/period branch therefore reproduces the defect this thread is about, in a tidier disguise. You are also right that my table hid it, since the two windows had genuinely different underlying performance.

So the option I proposed was a trap: it looked rigorous and would have drifted with the window anyway. Dropping it also removed the enum, the configuration, the three new labels and their translations. The PR is down to three files and two changed lines in WidgetFactory.

One thing to add in support of your conclusion. The log/simple mismatch does not disappear when annualizing, it becomes second order. The IRR is a simple rate, the volatility a log dispersion. Over one year, ln(1.1776) against 0.1776 is about 8%. Over the cumulated 5.9-year window, ln(2.467) against 1.467 is about 38%. Annualizing is therefore not only the comparable choice but also the one that keeps the residual inconsistency small.

Strictly, the coherent numerator would be ln(1 + IRR). I have deliberately not done that: it would make the widget disagree with the IRR displayed everywhere else in the application, trading a small technical inconsistency for a large user-facing one. Worth recording as a known approximation rather than pretending the annualized version is exact.

On serial independence. Agreed, and I think you framed it correctly: the same assumption applies in both directions, so it argues for neither. Worth putting in the code comment rather than leaving implicit.

On the Rendite/Volatilitat chart. I agree the defect bites harder there, for the reason you give: a single number can be rescaled mentally, a slope cannot. I am keeping it out of my PR because adding annualized options to both axes of that chart is already being discussed on the GitHub issue, and I would rather not fork that work. The slope framing would be worth raising there directly, since it is an argument about that view specifically.

Something else caught my eye while reading through the code, though it is outside what this PR set out to fix and has been there all along.

The numerator comes from getPerformanceIRR(), so the ratio pairs a money-weighted return with a cash-flow-neutral dispersion. The volatility is computed from the return series and does not know about deposits and withdrawals at all, while the IRR depends on them by construction. That predates the time-scaling question entirely and would remain once the annualization is in.

The practical consequence is that the value can move without anything about the portfolio changing. Two people holding identical positions over the same window get different Sharpe ratios purely because they paid in at different times, even though the denominator is identical for both. And the direction is systematic rather than random: with regular contributions into a rising market the IRR sits below the TTWROR, because the larger capital arrives late and the early gains ran on small amounts. The metric then quietly penalises saving regularly, which is not what a risk-adjusted measure is supposed to express — risk-adjusted performance should be a property of the investment, not of the investor’s payment schedule.

This also seems different in kind from the log/simple mismatch discussed above. That one is a small approximation that gets smaller once annualized. This one does not shrink with the window and has no obvious upper bound.

The consistent choice would be the annualized TTWROR, which the application computes anyway. Numerator and denominator would then be derived from the same time series, which is what the definition assumes: Sharpe’s ratio is built on a single series of returns, with no cash flows in it, since it was formulated for funds and strategies rather than for individual portfolios.

One caveat so it is on the record: strictly, the definition calls for the arithmetic mean of the excess returns, whereas an annualized TTWROR is a geometric mean, and the gap is roughly sigma^2/2 and therefore larger for riskier portfolios. But the geometric variant is what most providers publish and what every other figure in the application is, so I would not treat that as blocking — a code comment recording the approximation seems proportionate.

I am not suggesting this go into the current PR. Swapping the numerator is a design decision rather than a local fix, and the time-scaling change stands on its own regardless. If you think the point is worth pursuing, I am happy to open a separate issue for it.

Agreed on the substance, and you are right that it is a different class of problem from the log/simple one. That one shrinks as you annualize; this one does not shrink at all.

One correction on the direction, though. My own file has the IRR above the annualized TTWROR: 17.76% against 16.62% p.a. since inception, with regular contributions throughout. The yearly figures explain it - 2023 and 2024 were negative, 2025 and 2026 strongly positive - so the good years landed when the capital was largest, which pulls the money-weighted figure up rather than down. The sign depends on how returns are sequenced relative to when the money arrived, not on contributing regularly as such.

That cuts in your favour if anything. A systematic bias would at least be something a user could reason about. A distortion whose sign depends on each investor’s payment history is one nobody can correct for mentally, and two people holding the same positions genuinely cannot compare their numbers.

The two axes are worth separating explicitly, because they are independent. What this PR fixes is that the same portfolio reads differently depending on the reporting window. What you are describing is that the same portfolio reads differently depending on who holds it. Fixing either does nothing for the other, and neither is a reason to defer the other.

So yes, please open the separate issue. Swapping getPerformanceIRR() for getFinalAccumulatedAnnualizedPercentage() is a two-line change in the widget but a change of definition, so it wants its own thread and Andreas’s call rather than being folded into a time-scaling fix. The arithmetic-versus-geometric caveat belongs there too, and I agree a code comment is proportionate given every other return figure in the application is geometric anyway.