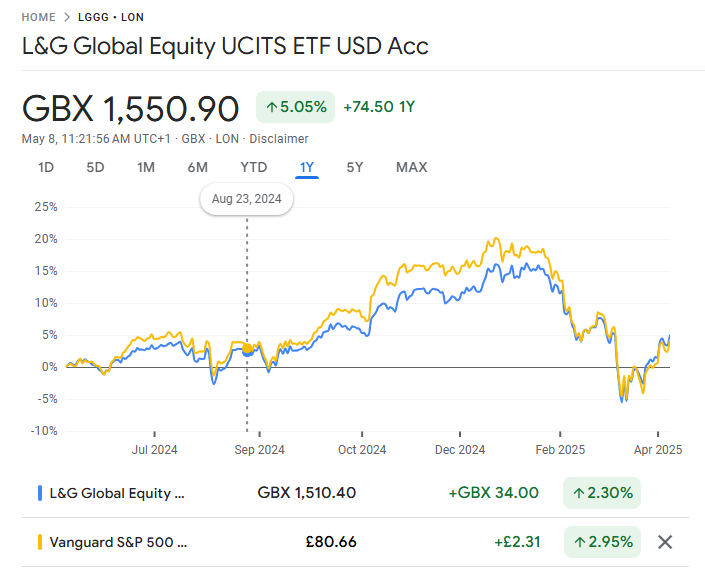
I think it would be very useful if we could select more than one security and have the performance of both securities display in a single chart - similar to the comparison feature in Google Finance.
I’m quite new to the Portfolio-Performance. Is this already possible via a difference method?
Jo92
May 8, 2025, 11:01am
2
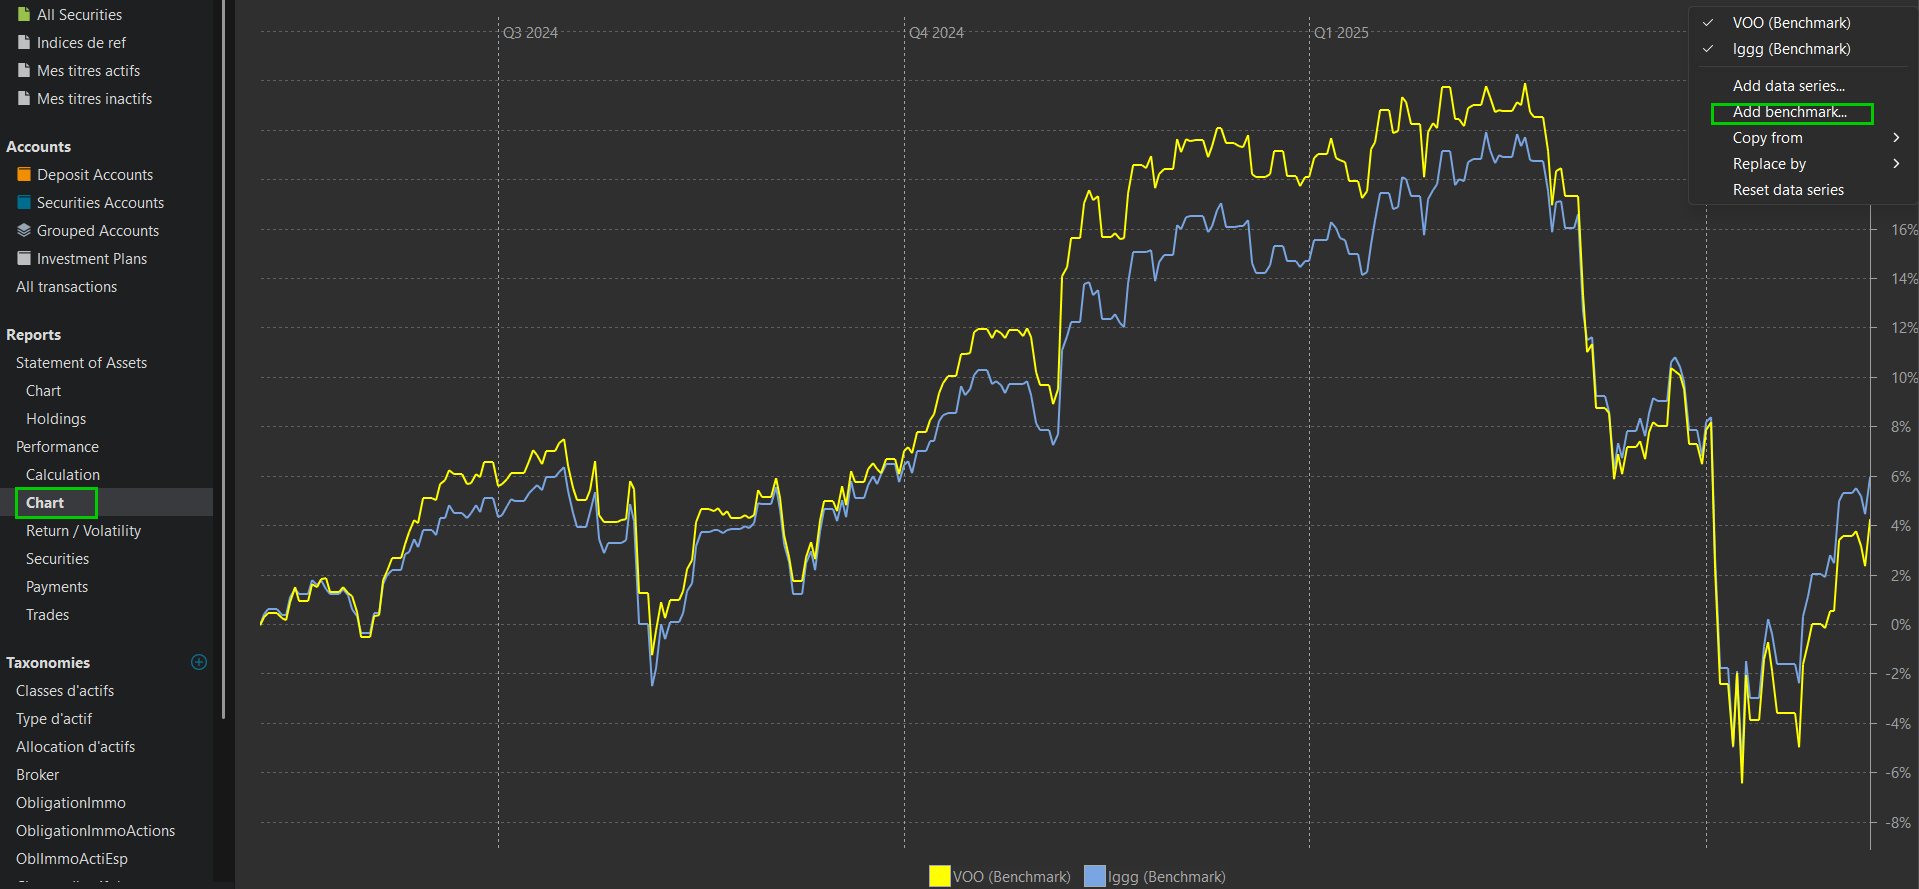
Under Performace → Diagram you could add them for comparison.
Hello, yes this is possible in the Performance Chart by adding them as benchmark :
Manual : Benchmarking your portfolio - Portfolio Performance Manual
Adjusted the topic, as this feature is available.
A friendly remark:
The forum is full of useful tips and tricks, How-to’s and other stuff.
This handbook introduces Portfolio Performance, explains portfolio management, performance calculation (TWRR, internal rate of return), and first steps (portfolio file, securities, import). It emphasizes the advantages over Excel and calls for...
I can only recommend getting familiar with PP before jumping in with 2 foots.
Sorry. I’ll try to use the search function in future.
No need to apologize. It was a friendly reminder only.
In German section this feature was also requested:
Hallo zusammen, eine kurze Frage: Kann man sich ein Diagramm erstellen, in dem der Kursverlauf mehrerer WP angezeigt wird?
Wenn ich auf Wertpapiere gehe, kann ich zwar einzelne Papiere auswählen.
Aber ich hätte gerne ein Diagramm, in dem meine beiden ETFs zusammen angezeigt werden. Damit man den unterschiedlichen Verlauf der beiden erkennen kann. Z. B. World zu Europa.
so z. B.:
https://www.fondsweb.com/de/vergleichen/ansicht/isins/DE000ETFL581,DE000ETFL565
In den Performance- oder Vermögen…
Hallo,
kann ich irgendwie auch mehrere Aktien übereinander legen um deren Verlauf im Vergleich zu sehen.
Hier geht es mir NICHT um den verlauf der Aktien die ich habe oder hatte, sondern wenn ich z.B. mir 3 verschiedene neue Aktien im Verlauf gleichzeitig ansehen will, weil ich dies evtl. als Kaufentscheid heran ziehe?
Hoffe Ihr versteht was ich meine.
I can say that I was working on this function, but did not get it to a state where I would request a review by @AndreasB .
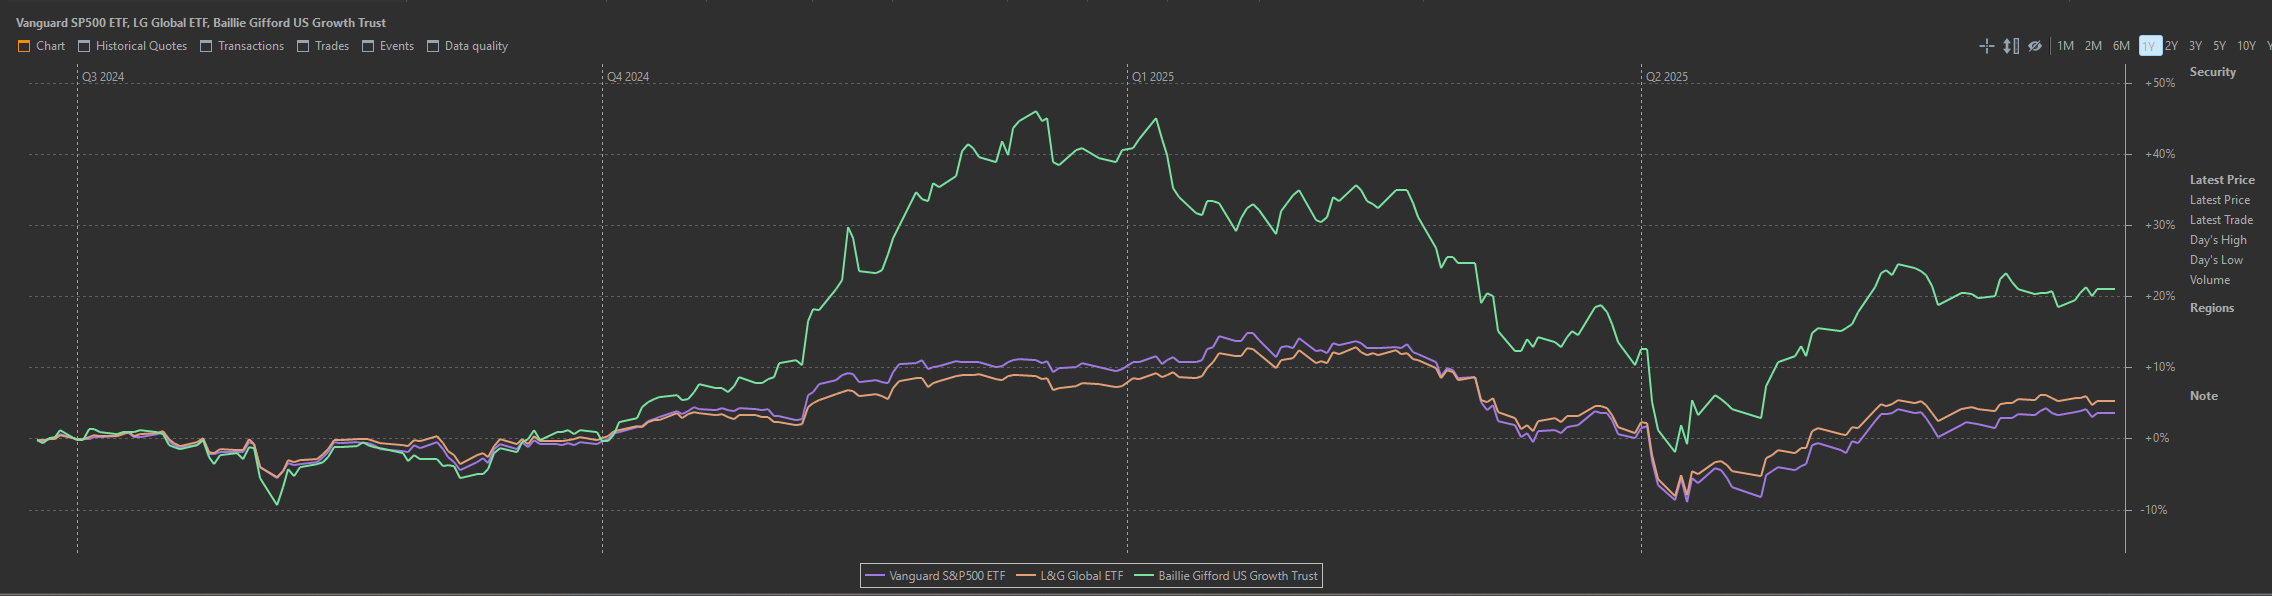
I’ve created a PR with the current development state. There you can also see a screenshot how it could look like:
master ← OnkelDok:multiple_securities_chart
offen 12:47PM - 10 May 25 UTC
As soon as you select more than one security, their charts will be displayed tog… ether. First working version:

There are still some things to do.
My plan would be to get this to a base working version for a merge/release. Then with feedback from users we can improve it.
Of course only with approval from @buchen.
Because I introduced ``SecuritiesChartPainter`` and copied a lot of code from ``SecuritiesChart`` to it some weeks ago I have to check wich changes were applied to the ``SecuritiesChart`` in the main branch the lasts weeks/months to also bring them into to ``SecuritiesChartPainter`` to not lose those changes.
My biggest concern is that the changes could lie around for too long and in the meantime further changes could be made in ``SecuritiesChart``, which would then have to be transferred manually. But that's also down to me. I have to get the PR finished.
---
**EDIT:**
@buchen, the reason for creating serparate class ``SecuritiesChartPainter`` was to split functions for drawing and configuration. It is also possible to implement it in the existing ``SecuritiesChart``, but then we have to introduce a second local field for the chartconfig, because for the multi-mode the chart config will be overwritten (one field for the user-chosen modes and one for the painting). But with two fields it can more easily be possible to use the wrong field.
If you say we should stay with one file instead of two, I can change this.
The disadvantage of two files is the first initial huge amount of changes. I assume when we keep all in one file (in ``SecuritiesChart``) then there wont be that much changed lines. Because basically the only functional changes in drawing the charts are a loop around the update-chart sequence and the logic to switch between single- and multi-mode. The rest ist non-functionial.
There are still some open points to do and probably to discuss.
That looks great. Thanks for your hard work.
For completeness: The feature was introduced with version 0.77.0 .
I just tried the feature hoping it might have been added and it worked.
Thanks so much for doing this. I think it’s a really great feature.
Would it be possible to go one step further and add the bottom row Sum to the comparison, so that individual holdings can be compared to the overall portfolio performance?